Introduction
The Middle Atlantic Bight (MAB) is the region of the Northwest Atlantic Ocean that includes the continental shelf waters extending from Great South Channel in the north to Cape Hatteras in the south (Fig. 1). The shelf slopes gently offshore and much of the bight from New York City southward has depths less than 50 m. The relatively cool and low saline water that enters the region from the north is part of a larger-scale coastal current system that originates in the Labrador Sea (Chapman and Beardsley, 1989). The average circulation on the shelf is slow (0.10 ms-1) southwestward flow until it is absorbed into the Gulf Stream near Cape Hatteras (Beardsley et al., 1985). The shelf is abutted on the seaward side by slope water that has circulation similar to the shelf and regularly contains Gulf Stream warm-core rings. A strong shelf/slope front occurs at the shelf edge where there is an abrupt gradient to warmer, more saline water offshore. Further seaward is the relatively rapid northeastward flow of the Gulf Stream.
The waters of the MAB undergo the typical annual temperature cycle characteristic of temperate regions. Temperature warms in spring to a summer maximum, followed by gradual cooling until the winter minimum is reached. Waters become stratified in spring and summer with a warm surface layer underlain by a distinct thermocline. Beneath it is a layer of cooler water called the “cold pool” (Bigelow, 1933), which persists until the normal seasonal overturn. The average seasonal and interannual patterns of circulation, temperature, and salinity have been described for the region in several previous studies (e.g. Bigelow, 1933; Manning, 1991; Mountain, 2004).
There is a growing body of evidence that climate related and anthropogenic processes are altering Northwest Atlantic marine ecosystems (Frank et al., 2005; Greene and Pershing, 2007; Nye et al., 2009). Zooplankton community structure in the Gulf of Maine and on Georges Banks shifted to a greater dominance by smaller sized species when salinity decreased during the early 1990s (Pershing et al., 2005; Kane, 2007). It has been shown that this low salinity water originated from further north, off Labrador (Houghton and Fairbanks, 2001), perhaps because of an increased export of freshwater from the Arctic due to local warming (Greene and Pershing, 2007). This influx of low salinity water affected all shelf waters from the Arctic to the MAB (Mountain, 2004). Since the average circulation in the Gulf of Maine and Georges Bank regions continues into MAB shelf waters, the zooplankton community there may also been altered by these changes in water properties. Previous studies have suggested that MAB secondary production is inextricably linked to the upstream regions of the ecosystem (Miller et al., 1998; Kane, 2005). Long term data also indicates that the range of sea surface temperature is increasing throughout the region, modifying species distribution and abundance patterns (Nye et al., 2009; Friedland and Hare, 2007). There is concern that these recent perturbations may have affected the zooplankton food stocks of the important commercial fish species that reside in the MAB for all or part of their life cycle.
NOAA Fisheries has monitored the spatial and temporal patterns of zooplankton abundance in the MAB since 1977. Seasonal research vessel surveys have collected vertically integrated plankton samples throughout the region, along with physical and other environmental data. Analysis of the first five and fifteen years of this time series documented interannual and seasonal variability, but found no evidence of a large-scale regime shift in zooplankton abundance (Sherman et al., 1983; Sherman et al., 1998). This study utilizes 18 additional years of data to examine how the MAB zooplankton community has responded to recent environmental and hydrographic variability. This report describes the interannual abundance variability of the common taxa that comprised the regions zooplankton community for the years 1977 to 2009. Multivariate analysis was used to determine if zooplankton community structure changed over the duration of the time series. In addition, to assess the link between zooplankton and environmental variability, interannual differences in zooplankton abundance were compared with year-to-year variations in temperature, salinity, phytoplankton abundance, and climatic indices.
Materials and Methods
Zooplankton Data
This analysis is based on the sorting results of 11 767 plankton samples that were collected on cruises that sampled throughout the MAB at approximately bimonthly intervals from 1977 to 2009 (Fig. 1). Surveys either occupied standard stations or selected locations from stratified random station plans that changed with each survey. Unpublished laboratory studies have demonstrated that zooplankton abundance and distribution patterns measured by the two sampling strategies were comparable. All samples were collected with a 0.333-mm mesh net fitted on one side of a 61 cm bongo frame (Posgay and Marak, 1980). The gear was towed obliquely at 1.5 knots to a maximum depth of 200 m or 5 m from the bottom and back to the surface, which ever was less. A flow meter was suspended in the center of the bongo frame to measure the volume of water filtered during the tow. Specimens were preserved in 5% formalin.
Zooplankton displacement volume, an index of biomass, was measured in the laboratory at least three months after collection (Kane, 1993). Samples were then reduced to approximately 500 organisms by sub sampling with a modified box splitter (Motoda, 1959; Jossi and Marak, 1983). Zooplankton specimens were then sorted, counted, and identified to the lowest possible taxa at the Plankton Sorting Center in Szczecin, Poland. Displacement volume is expressed here as cubic centimeters per 100 m3 of water filtered, and abundance as number per 100 m3.
Survey cruises did not cover the region at the same time each year, thus direct comparisons between annual survey abundance levels can be biased by temporal variability of sampling. To allow more valid comparisons between years, the average annual cycle of each taxon’s abundance was computed by fitting a spline curve function to the time-series bimonthly mean abundance values, calculated with data from complete surveys whose midpoint fell within the two month bin. This generates the expected abundance on any day of the year. Individual survey means were then subtracted from the projected abundance on the median day of that particular cruise. This created a data set of anomalies from the seasonal cycle for each year, which were then averaged to produce an annual abundance anomaly index. Restricting the statistical analysis to these values minimizes the temporal autocorrelation associated with the strong seasonality of zooplankton populations. This study was limited to the 26 taxa whose time-series mean was at least 1 000 per 100 m3 or its percent occurrence ≥ 25%. All data were log transformed log10 (χ+1) prior to analysis. Abundance indices were not calculated for the years 1989–1992 because financial constraints prevented plankton dedicated surveys in this period.
Environmental Data
Temperature and salinity measurements were routinely made on all surveys. Surface temperature measurements were made with a stem thermometer from a surface bucket sample from 1977 to 1998, and with a thermistor attached to the vessel from 1999 to 2009. Bottom temperature, surface salinity, and bottom salinity were also measured using water bottles equipped with reversing thermometers from 1977 to 1986, while latter years used a CTD instrument. Annual anomalies for these variables were calculated using the same methods that were described earlier for the zooplankton abundance index. Hydrographic sampling was too sparse from 1988 to 1990 to calculate annual values for bottom temperature and salinity variables for these years.
Phytoplankton biomass information was collected concurrently on monthly Continuous Plankton Recorder (CPR) surveys along a transect that began close to New York City Harbor and extended southeastward across shelf waters (Fig. 1). The CPR filters water through silk gauze with a 0.270 mm mesh that is cut into 18.5 km sections. Alternate sections of silk were examined and assigned a phytoplankton color index to obtain a qualitative indicator of phytoplankton biomass. This value is based on a visual assessment of the intensity of the green coloration found on the filtered silk, which is assigned numerical values in four categories by comparison with standard color charts (Richardson et al., 2006). It has been shown to be a relevant measure of in situ chlorophyll concentration (Batten et al., 2003). Values of the index were compared with shelf-wide chlorophyll measurements made from 1978–1984 to determine if trends derived from transect and broad scale surveys are comparable. Annual anomalies of both phytoplankton biomass measurements were calculated using the same methods that were described for zooplankton abundance.
The zooplankton abundance time series was compared with concurrent years of three broad-scale indices of climate variability known to affect physical and biological measurements across the North Atlantic: 1) the winter phase of the North Atlantic Oscillation (NAO), 2) the Gulf Stream North Wall Index (GSI), and 3) the Atlantic Multidecadal Oscillation (AMO). The NAO is an index that is based on the difference of normalized sea level pressures between Lisbon, Portugal and Stykkisholmur / Reykjavik, Iceland from the months of December through March (Hurrell, 1995) (http://www.cgd.ucar.edu/cas/jhurrell/nao.stat.winter.html). The GSI is a measure of the position of the north wall of the Gulf Stream as it diverges from the North American coastline (Taylor et al., 1992; Taylor, 1995) (http://www.pml-gulfstream.org.uk/data.htm). Its location is believed to be governed by interannual changes in regional circulation patterns (Rossby and Benway, 2000). The AMO is a mode of natural variability occurring in the North Atlantic that is primarily associated with low frequency changes in sea surface temperature (Kerr, 2000) (http://www.esrl.noaa.gov/psd/data/correlation/amon.us.data). The index is characterized by alternating cool and warm phases that last several decades.
Data Analysis
Calculations of species diversity were made for each sample using the Shannon diversity index (Shannon, 1948; Pielou, 1969):

where n = total number of species in sample, fi is the relative frequency of species or taxonomic group i. H’ index values for each sample were averaged yearly to assess interannual changes in species diversity through the time series. Diversity is increased when individuals are evenly distributed among taxa, and decreases when a few taxa dominate overall abundance. Regression analysis was applied to the time series to determine if the slope of the linear fit differed significantly from zero.
Multivariate techniques using the PRIMER 6.1.5 software package (Clarke and Warwick, 2001) were used to determine if zooplankton community structure had changed through the time series. Initially, the biotic relationship between any two years was represented by the Bray-Curtis index (Bray and Curtis, 1957), which measures the similarity (or dissimilarity) in species composition. The triangular matrix of similarity between each pair of years was then classified into groups using two techniques: 1) hierarchical agglomerative cluster analysis with similarity permutation tests (SIMPROF) to delineate significant groupings and 2) non-metric multi-dimensional scaling (MDS). Clusters of statistically significant (p< 0.05) years that were also isolated by low stress (<0.20) MDS ordinations were judged to be years with similar zooplankton community structure. Analysis of similarity percentages (SIMPER) was used to identify taxa responsible for the dissimilarity between these groups of years. Principal component analysis (PCA) of the abundance anomaly time series was also performed to examine relationships in the data. Plots of the first two principal components provided a means to identify similar years and portray long term trends.
Spearman’s rank correlation analysis of annual anomalies was used to show connections between and among zooplankton and environmental variables. Autocorrelation in the data was accounted for by adjusting the effective degrees of freedom (N*) of each test using the following procedure (Pyper and Peterman, 1998):
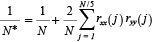
where N is the number of sample pairs, and rxx(j) and ryy(j) are the sample autocorrelation of x and y at lag j (Box and Jenkins, 1976). The probability of rejecting a true null hypothesis was set low (α = 0.01) to ameliorate the effects of multiple hypothesis tests.
Results
The abundance of the 26 taxa examined here comprised 93.7% of the total zooplankton captured during the bongo time series (Table 1). The calanoid copepod Centropages typicus was the most abundant species identified and was present in 95.3% of the samples. The cladoceran Penilia avirostris had the second highest mean abundance, but had a comparatively low frequency occurrence (23.4%). The next most abundant taxa were the copepod Pseudocalanus spp., echinoderm larvae, and the copepod Temora longicornis (Table 1).
Zooplankton diversity and cumulative indices all trended slightly upward during the time series (Fig. 2). The slopes of the linear fits were all significantly different from zero (p<0.01) with modest correlation coefficients (0.16–0.28). Annual means of total sample counts and biomass were mostly above the time series average during the 1990s and 2000s (Figs. 2b and 2c).
Cluster analysis of the annual anomalies and the underlying SIMPROF procedure delineated three significantly different (p<0.01) successive groups of years at the 90% similarity level: A) 1977 and 1978, B) 1979–1988, and C) 1993–2009 (Fig. 3a). The MDS ordination plot (stress = 0.14) coincided with the cluster dendrogram, partitioning and aligning the years into similar groupings (Fig. 3b). The two ordinations both indicated that zooplankton community structure has been gradually transforming since the time series was initiated in 1977. The SIMPER procedure found that the abundance variability of five taxa were most responsible for splitting the years into these particular assemblages. They were: Oithona spp., appendicularians, thecosomata, echinoderms, and hyperiid amphipods. These taxa all displayed rising abundance trends through the time series and nearly all were minimal in 1977 and 1978 (Fig. 4).
The PCA ordination of the annual anomalies produced a map nearly identical to the MDS analysis (data not shown). The first principal component explained 38.3% of the total variation and its time series displayed the same annual pattern as the zooplankton cumulative indices, with above average scores from 1993 onward (Fig. 5). This pattern had a strong linear fit that assigned positive weights to 22 of the 26 taxa, with the three largest values assigned to Oithona spp., thecosomata, and Paracalanus parvus. These taxa had above average abundance levels during most of the 1990s and 2000s (Fig. 4).
Species associations were analyzed in greater detail by calculating pair-wise correlation coefficients between annual abundance anomalies. There was a group of eleven taxa whose abundance patterns were all positively correlated to each other, with many values that were highly significant (p<0.01) (data not shown). The taxa were: Echinodermata, Thecosomata, Appendicularia, Paracalanus parvus, Oithona spp., Chaetognatha, Hyperiidae, Nannocalanus minor, Clausocalanus arcuicornis, Siphonophora, and Euphausiacea. This group of taxa with similar year-to-year patterns was condensed into one major sub-grouping (named corr11) by averaging individual annual anomalies into a single value. The subgroups integrated time-series trend line clearly shows that its abundance was above average during the second half of the sampling period (Fig. 6a). This increasing pattern was highly correlated to surface temperature measurements and the climatic variability associated with the AMO index (Table 2). These two latter variables also had increasing trend lines during the second half of the time series (Figs. 6b and 6c). Linear regressions between the corrll and temperature indices were highly significant (p<0.01). Notable was the high negative correlation that the corr11 group and total zooplankton counts had with phytoplankton color (Table 2). This index was variable through the time series, but was mostly below average during the 1990s and early 2000s (Fig. 6d).
A second smaller group of six taxa also had positively correlated abundance trends: Centropages typicus, Pseudocalanus spp., Temora longicornis, Metridia lucens, Centropages hamatus, and Evadne spp. The integrated trend lines for this sub-group (named corrr6) suggest that high levels from 1996 to 1998 and below average values in the mid 2000s characterize this grouping (Fig. 7a). Annual anomalies were negatively correlated to all the environmental variables except for phytoplankton color, which had a weak positive value (Table 2). The high abundance levels observed during the late 1990s occurred when salinity measurements were at the time series minimum (Fig. 7b).
The remaining eight taxa all had mostly indistinctive interannual patterns that were not significantly correlated to any of the environmental or climatic variables. All correlations between zooplankton abundance and the NAO and GSI indices were weak and insignificant (Table 2).
Discussion
The zooplankton population found within MAB waters is thriving. The data indicates that overall counts and biomass levels have been trending upward in the 1990s and 2000s. Abundance levels of several individual taxa have slowly increased during this time period. These changes caused multivariate analysis to distinguish three groups of continuous years that had different community structure. These groupings were not the result of dramatic changes in diversity or in the occurrence of key species, but reflect small changes in the abundance of many species. This has elevated zooplankton cumulative abundance indices to above average levels during most years from 1993 onward.
The increasing zooplankton stocks were found associated with rising surface temperatures in the region. Eleven taxa had increasing abundance trends that were positively correlated to the warming waters of the MAB. This group of taxa was also positively associated with the AMO index, the climatic variable that relates to the natural mode of variability found in North Atlantic sea surface temperature. The AMO index has been increasing steadily since the mid-1970s (Fig. 6c), indicating that waters over the entire North Atlantic have been slowly warming.
The impact that temperature has on nutrient enrichment in the ocean is perhaps the key factor that determines food web dynamics in many regions. Warming surface waters increase stratification and limit the mixing of deep nutrient-rich waters into surface layers (Kamykowski and Zentara, 2005). This could alter the structure of the phytoplankton community, whose trophodynamics would become more dependent on recycled nitrogen. Evidence for this linkage in MAB waters can be found in the time series trend of the phytoplankton color index. The CPR phytoplankton color index was below average during most of the 1990s and 2000s (Fig. 6d). Though the index is certainly an indirect measure of phytoplankton biomass in the region, fluctuations of shelf wide chlorophyll measurements made from 1978 to 1984 (O’Reilly and Zeitland, 1998) are comparable to the index (Fig. 6d).
How can total numbers and biomass of zooplankton be trending upward as phytoplankton food stocks decline? One explanation could be top-down control of phytoplankton biomass by the rising numbers of herbivorous zooplankton, similar to the trophic cascades observed in the Scotian Shelf ecosystem (Frank et al., 2005). However, this seems unlikely because the abundance of the dominant, large sized copepods Centropages typicus and Calanus finmarchicus are not trending upward in the time series. An alternative hypothesis could be that only the large phytoplankton cells retained by the relatively coarse mesh used in the CPR have diminished, while the smaller size fraction has increased. In theory, the nutrient depleted waters of the warmer and more stratified waters of the MAB will not support the larger phytoplankton cells and a more microbial-dominated community will be established (Roemmich and McGowan, 1995; Cushing, 1989). Though the color is declining, there could be new, increased stocks of small dinoflagellates and microbial prey that may have enhanced reproduction of certain species and fueled the recent zooplankton increase. Since rising sea surface temperatures have been associated with decreasing phytoplankton abundance in the Northeast Atlantic (Richardson and Schoeman, 2004) and to changes in the timing of the North Sea spring bloom (Wiltshire and Manly, 2004), the base of the marine food web may be undergoing large-scale changes. The biological implications of such a change could resonate up through the entire food chain and impact higher trophic levels. However, it must be stressed that detailed long-term studies on phytoplankton species composition and diversity will be needed to determine if the food web has shifted in the MAB.
Zooplankton community abundance increases have been indirectly linked to warming in the upstream, northern half of the US northeast shelf ecosystem. A group of comparatively small copepods all increased during the early 1990s in the Gulf of Maine (GOM) and Georges Banks (GBK) regions (Pershing et al., 2005; Kane, 2007), remained high through 2001, and declined sharply thereafter. Both investigations found that these abundance increases coincided with freshening of shelf waters due to increased inflow of lower salinity water from the Scotian Shelf, likely caused by warming that increased freshwater fluxes from the Arctic (Greene and Pershing, 2007). Abundance declined sharply in the early 2000s when salinity increased after a decade of low values (Pershing et al., 2005; Kane, 2007). The copepods whose abundance increased upstream during the 1990s were members of the corr6 group identified here that surged in the late 1990s, when this pulse of fresher water moved downstream and lowered salinity in MAB waters. Pershing et al. (2005) hypothesized that lowered salinity in the Gulf of Maine stabilized the water column enough to enhance primary productivity and support high zooplankton production. However, this does not appear to be the case in the MAB, where the phytoplankton color index was at or below average during the 1990s (Fig 6d). Zooplankton production can be influenced by a variety of factors that intertwine to regulate population levels. Perhaps the increased freshening affected the timing of MAB phytoplankton blooms that led to enhanced productivity for the corr6 taxa group. Modeling studies upstream have demonstrated that surface freshening can substantially change water column stability and affect the timing of phytoplankton blooms (Ji et al., 2008).
Temperature affects numerous processes that influence the population dynamics of zooplankton. It can indirectly alter the food web through multi-step “bottom up” or “top down” alterations (Frank et al., 2005; Polovina et al., 2008), or directly regulate metabolic factors such as growth and reproduction (Portner and Farrell, 2008). Some studies have been able to link alterations in the distribution and phenology of zooplankton to current warming trends (Drinkwater et al., 2010), but there has been only limited success associating community abundance changes to increasing temperatures (Richardson, 2008). The difficulty is that responses to increasing temperatures are species specific, and the outcome will likely depend on how the warming affects the timing of critical events in the life history of that organism. In the MAB, the corr11 taxa group was composed of both holo and meroplankton species with different seasonal cycles, food preferences, and life history strategies. This study has offered explanations for the observed patterns, but until these observations are supplemented with detailed information on the life history of all the individual species, it will be difficult to adequately explain how increased warming is changing community structure.
The waters of the MAB are warming (Freidland and Hare, 2007; Belkin, 2009) and models indicate this trend is likely to continue (Solomon et al., 2009). The region has experienced a consistent warm period that has caused surface waters to trend upward from 1997 onward (Fig 6b). There is concern that the effects of greenhouse warming and the natural conditions represented by the AMO index will combine to accelerate current warming trends in the Atlantic ocean (Sutton and Hodson, 2005). Climate change is impacting Northwest Atlantic waters where there has been an increase in the southerly flow of cooler, fresher surface waters to lower latitudes (Greene and Pershing, 2007). These changes have coincided with shifts in zooplankton community structure (Pershing et al., 2005; Kane, 2007) and the southward movement of arctic and subarctic plankton species in the northern areas of the region (Johns et al., 2001; 2003). However, the increased influx of cooler, low salinity water into the Gulf of Maine did not chill the downstream waters of the MAB, likely because local conditions and mixing combined to warm surface waters during transport. Instead, this report has found that decadal scale warming has coincided with the increased abundance of many common zooplankton taxa.
Thus far, the zooplankton population present in the MAB is stable. There have been no major shifts in species occurrence or diversity from 1977 to 2009, and the community structure presented here resembles those defined in earlier studies of the region (Grice and Hart, 1962; Wiebe et al., 1973). Regional observations on zooplankton biomass measurements made in the early 1930s (Bigelow and Sears, 1939) were comparable and not significantly different from values recorded in the first five years of the bongo time series (Sherman et al., 1983). Since values in recent years are above the early ones used for the comparisons, one can infer that zooplankton levels today are more than sufficient to help rebuild the regions depleted fish stocks. The results here highlight the importance of long-term time series to measure the response of lower tropic levels to anthropogenic and natural oscillations within marine ecosystems.
Acknowledgements
I thank the numerous people who worked hard to collect and process the time series of zooplankton and environmental measures used in this report. Special thanks to Jon Hare for providing valuable comments on an earlier draft of the manuscript.
References
BATTEN, S. D., A. W. WALNE, M. EDWARDS, and S. B. GROOM. 2003. Phytoplankton biomass from continuous plankton recorder data: assessment of the phytoplankton colour index. J. Plankton Res., 25: 697–702. doi:10.1093/plankt/25.7.697
BEARDSLEY, R. C., D. C. CHAPMEN, K. H. BRINK, S. R. RAMP, and R. SCHLITZ. 1985. The Nantucket shoals experiment (NSFE79), part 1, A basic description of the current and temperature variability. J. Phys. Oceanogr., 15: 713–748. doi:10.1175/1520-0485(1985)015<0713:TNSFEP>2.0.CO;2
BELKIN, I. M. 2009. Rapid warming of Large Marine Ecosystems. Prog. Oceanogr, 81: 207–213. doi:10.1016/j.pocean.2009.04.011
BIGELOW, H. B. 1933. Studies of the waters on the continental shelf, Cape Cod to Chesapeake Bay. I. The cycle of temperature. Pap. Phys. Oceanogr. Meteor., 2: 1–135.
BIGELOW, H. B., and M. SEARS. 1939. Studies of the waters on the continental shelf, Cape Cod to Chesapeake Bay. III. A volumetric study of the zooplankton. Mem. Mus. Comp. Zool., Harvard University, 54: 179–378.
BOX, G. E. P., and G. W. JENKINS. 1976. Time series analysis: forecasting and control. Holden-Day, San Francisco, CA.
BRAY, J. R., and J. T. CURTIS. 1957. An ordination of the upland forest communities of Southern Wisconsin. Ecol. Monograph., 27: 325–349. doi:10.2307/1942268
CHAPMAN, D. C., and R. C. BEARDSLEY. 1989. On the origin of shelf water in the Middle Atlantic Bight. J. Phys. Oceanogr., 19: 384–391. doi:10.1175/1520-0485(1989)019<0384:OTOOSW>2.0.CO;2
CLARKE, K. R., and R. M. WARWICK. 2001. Changes in marine communities: an approach to statistical analysis and interpretation, 2nd edition. PRIMER-E, Plymouth.
CUSHING, D. H. 1989. A difference in structure between ecosystems in strongly stratified waters and in those that are only weakly stratified. J. Plankton Res., 11: 1–13. doi:10.1093/plankt/11.1.1
DRINKWATER, K. F., G. BEAUGRAND, M. KAERIYAMA, S. KIM, G. OTTERSEN, R. I. PERRY, H. PORTNER, J. J. POLOVINA, and A. TAKASUKA. 2010. On the processes linking climate change to ecosystem changes. J. Mar. Sys., 79: 374–388. doi:10.1016/j.jmarsys.2008.12.014
FRANK, K. T., B. PETRIE, J. S. CHOI, and W. C. LEGGETT. 2005. Trophic cascades in a formerly cod-dominated ecosystem. Science, 308: 1621–1623. doi:10.1126/science.1113075
FRIEDLAND, K. D., and J. A. HARE. 2007. Long-term trends and regime shifts in sea surface temperature on the continental shelf of the northeast United States. Cont. Shelf Res., 27: 2313–2328. doi:10.1016/j.csr.2007.06.001
GREENE, C. H., and A. J. PERSHING. 2007. Climate drives sea change. Science, 315: 1084–1085. doi:10.1126/science.1136495
GRICE, G. D., and A. D. HART. 1962. The abundance, seasonal occurrence, and distribution of the epizooplankton between New York and Bermuda. Ecol. Monogr., 32: 287–308. doi:10.2307/1942377
HOUGHTON, R. W., and R. G. FAIRBANKS. 2001. Water sources for Georges Bank. Deep-Sea Res. II, 48: 95–114. doi:10.1016/S0967-0645(00)00082-5
HURRELL, J. W. 1995. Decadal trends in the North Atlantic Oscillation: Regional temperatures and precipitation. Science, 269: 676–679. doi:10.1126/science.269.5224.676
Ji, R., C. S. DAVIS, C. CHEN, D. W. TOWNSEND, D. G. MOUNTAIN, and R. C. BEARDSLEY. 2008. Modeling the influence of low-salinity water inflow on winter- spring phytoplankton dynamics in the Nova Scotian Shelf - Gulf of Maine region. J. Plankton Res., 30: 1399–1416. doi:10.1093/plankt/fbn091
JOHNS, D. G., M. EDWARDS, and S. D. BATTEN. 2001. Arctic boreal plankton species in the Northwest Atlantic. Can. J Fish. Aquat. Sci., 58: 2121–2124. doi:10.1139/f01-156
JOHNS, D. G., M. EDWARDS, A. RICHARDSON, and J. I. SPICER. 2003. Increased incidence of winter phytoplankton blooms in the Northwest Atlantic. Mar. Ecol. Prog. Ser., 265: 283–287. doi:10.3354/meps265283
JOSSI, J. W., and R. R. MARAK. 1983. MARMAP plankton survey manual. NOAA Tech. Mem. NMFS-F/NEC-21, 258 p.
KAMYKOWSKI, D., and S. ZANTARA. 2005. Changes in world ocean nitrate availability through the 20th century. Deep-Sea Res. I, 52: 1719–1744. doi:10.1016/j.dsr.2005.04.007
KANE, J. 1993. Variability of zooplankton biomass and dominant species abundance on Georges Bank, 1977–1986. Fish. Bull., 91: 464–474.
KANE, J. 2005. The demography of Calanus finmarchicus (Copepoda: Calanoida) in the Middle Atlantic Bight, USA, 1977–2001. J. Plankton Res., 27: 401–414. doi:10.1093/plankt/fbi009
KANE, J. 2007. Zooplankton abundance trends on Georges Bank, 1977–2004. ICES J. Mar. Sci., 64: 909–919. doi:10.1093/icesjms/fsm066
KERR, R. A. 2000. A North Atlantic climate pacemaker for the centuries. Science, 288: 1984–1985. doi:10.1126/science.288.5473.1984
MANNING, J. 1991. Middle Atlantic Bight salinity: interannual variability. Cont. Shelf Res., 11: 123–137. doi:10.1016/0278-4343(91)90058-E
MILLER, C. B., D. R. LYNCH, F. CARLOTTI, W. GENTLEMAN, and C. V. W. LEWIS. 1998. Coupling of an individual-based population dynamic model of Calanus finmarchicus to a circulation model for the Georges Bank region. Fish. Oceanogr., 7: 219–234. doi:10.1046/j.1365-2419.1998.00072.x
MOTODA, S. 1959. Devices of simple plankton apparatus. Memoirs of the Faculty of Fisheries, Hokkaido University, 7: 73–94.
MOUNTAIN, D. G. 2004. Variability of the water properties in NAFO Subareas 5 and 6 during the 1990s. J. North. Atl. Fish. Sci., 34: 103–112. doi:10.2960/J.v34.m475
NYE, J. A., J. S. LINK, J. A. HARE, and W. J. OVERHOLTZ. 2009. Changing spatial distribution of fish stocks in relation to climate and population size on the Northeast United States continental shelf. Mar. Ecol. Prog. Ser., 393: 111–129. doi:10.3354/meps08220
O’REILLY, J. E., and C. ZETLIN. 1998. Seasonal, horizontal, and vertical distribution of phytoplankton chlorophyll a in the Northeast U.S. Continental Shelf Ecosystem. NOAA Tech. Rep. NMFS 139, 128 p.
PERSHING, A. J., C. H. GREENE, J. W. JOSSI, L. O’BRIEN, J. K. T. BRODZIAK, and B. A. BAILY. 2005. Interdecadal variability in the Gulf of Maine zooplankton community, with potential impacts on fish recruitment. ICES J. Mar. Sci., 62: 1511–1523. doi:10.1016/j.icesjms.2005.04.025
PIELOU, E. C. 1969. An introduction to Mathematical Ecology. Wiley-Interscience, New York, 294 p.
POLOVINA, J. J., F. CHAI, E. A. HOWELL, D. R. KOBAYASHI, L. SHI, and Y. CHAO. 2008. Ecosystem dynamics at a productivity gradient: A study of the lower trophic dynamics around the northern atolls in the Hawaiian Archipelago. Prog. Ocean., 77: 217–224. doi:10.1016/j.pocean.2008.03.011
PORTNER, H. O., and A. P. FARRELL. 2008. Physiology and climate change. Science, 322: 690–692. doi:10.1126/science.1163156
POSGAY, J. A., and R. R. MARAK. 1980. The MARMAP bongo zooplankton samplers. J. Northw. Atl. Fish. Sci., 1: 91–99. doi:10.2960/J.v1.a9
PYPER, B. J., and R. M. PETERMAN. 1998. Comparison of methods to account for autocorrelation in correlation analysis of fish data. Can. J. Fish. Aquat. Sci., 55: 2127–2140. doi:10.1139/f98-104. doi:10.1139/f98-201
RICHARDSON, A. J. 2008. In hot water: zooplankton and climate change. ICES J. Mar. Sci., 65: 279-295. doi:10.1093/icesjms/fsn028
RICHARDSON, A. J., and D. S. SCHOEMAN. 2004. Climate impact on plankton ecosystems in the Northeast Atlantic. Science, 305: 1609–1612. doi:10.1126/science.1100958
RICHARDSON, A. J., A. W. WALNE, A. W. G. JOHN, T. D. JONAS, J. A. LINDLEY, D. W. SIMS, D. STEVENS, and M. WITT. 2006. Using continuous plankton recorder data. Prog. Ocean., 68: 27–74. doi:10.1016/j.pocean.2005.09.011
ROEMMICH, D., and J. MCGOWAN. 1995. Climatic warming and the decline of zooplankton in the California Current. Science, 267: 1324–1326. doi:10.1126/science.267.5202.1324
ROSSBY, T., and R. L. BENWAY. 2000. Slow variations in mean path of the Gulf Stream east of Cape Hatteras. Geophy. Res. Lett., 27: 117–120. doi:10.1029/1999GL002356
SHANNON, C. E. 1948. A mathematical theory of communication. Bell Sys. Tech. J., 27: 379–423.
SHERMAN, K., J. R. GREEN, J. R. GOULET, and L. EJSYMONT. 1983. Coherence in zooplankton of a large Northwest Atlantic ecosystem. Fish. Bull., 81: 855–862.
SHERMAN, K., A. SOLOW, J. JOSSI, and J. KANE. 1998. Biodiversity and abundance of the zooplankton of the Northeast Shelf Ecosystem. ICES J. Mar. Sci., 55: 730–738. doi:10.1006/jmsc.1998.0377
SOLOMON, S., G. K. PLATTNER, R. KNUTTI, and P. FRIEDLINGSTEIN. 2009. Irreversible climate change due to carbon dioxide emissions. Proc. Natl. Acad. Sci. USA, 106: 1704–1709. doi:10.1073/pnas.0812721106
SUTTON, R. T., and L. R. HODSON. 2005. Atlantic Ocean forcing of North American and European summer climate. Science, 309: 115–118. doi:10.1126/science.1109496
TAYLOR, A. H. 1995. North-south shifts of the Gulf Stream and their climate connection with the abundance of zooplankton in the UK and its surrounding seas. ICES J. Mar Sci., 52: 711–721. doi:10.1016/1054-3139(95)80084-0
TAYLOR, A. H., J. M. COLEBROOK, J. A. STEPHENS, and N.G. BAKER. 1992. Latitudinal displacements of the Gulf Stream and the abundance of plankton in the Northeast Atlantic. J. Mar. Biol. Ass., 72: 919–921. doi:10.1017/S0025315400060161
WIEBE, P. H., G. D. GRICE, and E. HOAGLAND. 1973. Acid-iron waste as a factor affecting the distribution and abundance of zooplankton in the New York Bight: II. Spatial variations in the field and implications for monitoring studies. Est. Coast. Mar. Sci., 1: 51–64.doi:10.1016/0302-3524(73)90057-1
WILTSHIRE, K. H., and B. F. J. MANLY. 2004. The warming trend at Helgoland Roads, North Sea: phytoplankton response. Helgo. Mar. Res., 58: 269–273. doi:10.1007/s10152-004-0196-
|