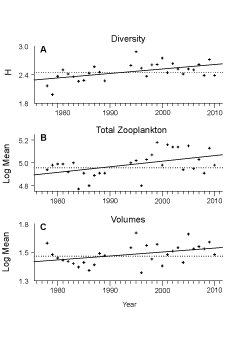
| Fig. 2. Annual mean values of zooplankton (A) diversity (B) total counts and (C) displacement volume values from plankton samples collected in the MAB from 1977 to 2009. The solid line is the linear regression and the dashed line is the time series mean. |