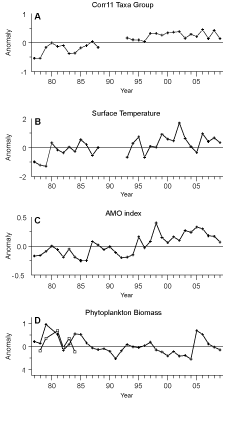
Fig. 6. (A) Annual mean abundance anomalies of the corr11 zooplankton group (see text in results section for taxa names) that had correlated annual abundance trends. Trends in temperature are represented by: (B) annual surface temperature anomalies and (C) the standardized AMO (Atlantic Multidecadal Oscillation) index. (D) Annual anomalies of the phytoplankton color index measured on CPR surveys. Superimposed on the index, with open square markers, are the depth integrated annual anomalies of netplankton (cells >0.20 µm) chlorophyll measured during the shelf wide 1978–1984 surveys.
|