J. Northw. Atl. Fish. Sci., Vol. 52: 1–18
Publication (Upload) date: 11 Jan 2021
Brooke A. Lowman1*, Catherine E. O’Keefe2, and Steven X. Cadrin1
1School for Marine Science and Technology, University of Massachusetts Dartmouth,
836 South Rodney French Boulevard,
New Bedford, MA 02744, USA
2Fishery Applications Consulting Team, 99 Bakerville Road,
Dartmouth, MA 02748, USA
*E-mail: blowman@umassd.edu
Lowman, B.A., O’Keefe, C.E., and Cadrin, S.X. 2021. Predictive Models of Yellowtail Flounder Bycatch in the U.S. Sea Scallop Fishery on Georges Bank. J. Northw. Atl. Fish. Sci., 52: 1–18. https://doi.org/10.2960/J.v52.m723
Abstract
Many commercial fisheries face bycatch challenges. Avoiding non-target species while maximizing harvest of target species may require fishing differently across seasons and years, so the ability to predict bycatch occurrence is important for efficient and sustainable fishing operations. We demonstrate a potential application of bycatch predictions in the Atlantic sea scallop (Placopecten magellanicus) fishery. Catch data from a bycatch survey were used to develop models for yellowtail flounder (Limanda ferruginea) bycatch in the scallop fishery in response to environmental variables, and the models were validated using at-sea observer data. Results indicate that location (latitude, longitude, management area), temperature, zenith angle (a proxy for ambient light), and temporal effects (season, month, year) affect the presence and abundance of yellowtail flounder bycatch in the scallop fishery. Simple models with a subset of variables (latitude, longitude, and month) were fitted to help predict the magnitude and location of bycatch prior to fishery openings and in areas with no bycatch information. This study demonstrates how predictive models can be used to avoid bycatch species.
Keywords: Atlantic sea scallop, bycatch avoidance, generalized additive model, yellowtail flounder
PDF
Download Citation Data

Citation to clipboard
 Reference management software (Endnote, Mendeley, RefWords, Zotero & most other reference management software)
LaTex, BibDesk & other specific software
Introduction
Bycatch is a common problem in commercial fisheries, and there are a variety of solutions to achieve bycatch reduction (O’Keefe et al. , 2013; Pérez Roda et al. , 2019). Gear modifications can prevent or reduce capture of unwanted species, fishing behaviour modifications can give non-target species an opportunity to escape fishing gear before being brought on board the vessel, and spatiotemporal measures can help fishing vessels avoid encounters with bycatch species. Avoiding bycatch species requires knowledge of where they co-occur with targeted species. This knowledge may be based on distribution maps from surveys or previous fishing, in-season communications, and predictive maps based on environmental models. We focus on predictive modelling as a potential resource for bycatch avoidance efforts.
Many advances have been made in species distribution modelling, with increasing aim towards ecological sensibility and interpretability (Guisan et al. , 2006; Valavanis et al. , 2008). Predictive mapping and distribution modelling are often used to support sustainable resource use. Generalized additive models and maximum entropy modelling have been used to predict abundance of pink shrimp (Politou et al. , 2008), squid habitat (Sanchez et al. , 2008), probability of occurrence and abundance of hake (Tserpes et al. , 2008), habitat overlap of alewife, herring, and Atlantic mackerel (Turner et al. , 2016), abalone fishing grounds (Jalali et al. , 2015), and skate egg nursery habitat (Rooper et al. , 2019).
In the current study, we use generalized additive models to predict yellowtail flounder (Limanda ferruginea) bycatch in the Atlantic sea scallop (Placopecten magellanicus) fishery in the northeast US. The most productive fishing grounds for Atlantic sea scallop are on Georges Bank (Caddy, 1989; Fig. 1). Although the scallop resource on Georges Bank is healthy, the yellowtail flounder stock status is poor (TRAC, 2019), resulting in low bycatch quotas that constrain the scallop fishery.
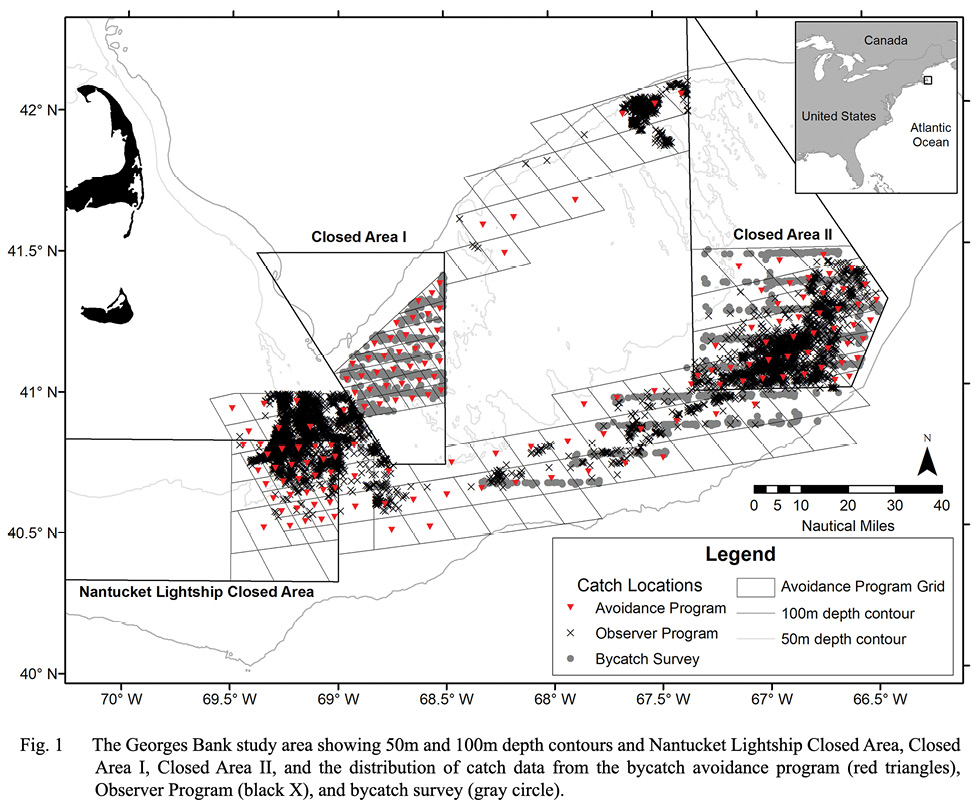
Fig. 1
The scallop fishery is managed by a rotational harvest strategy in which the Bank is divided into closed, access, and open areas (NEFMC, 2004). No harvesting is allowed in closed areas. “Access areas” are open to the scallop fleet for a limited number of trips in certain months and are closed in years when small scallops are abundant. Open areas are available year round to the scallop fishery. Prior to 2018, the fishery opened annually on March 1, and subsequently has opened on April 1. A majority of effort typically occurs in the spring and summer months, peaking in or around May. The scallop fishery management plan combines multiple regulatory techniques including quotas, days-at-sea limits in open areas, trip limits, and limited number of trips to and seasonal closures of access areas. The variety of regulations lends itself to some of the temporal effort patterns seen in the fishery over time, for example, there has traditionally been a surge in fishing activity in access areas when they first open.
In 2010, researchers at the University of Massachusetts Dartmouth School for Marine Science and Technology (SMAST) implemented a voluntary yellowtail flounder bycatch avoidance system in the scallop fishery (O’Keefe and DeCelles, 2013). Scallopers collected and reported bycatch data daily. SMAST staff used the data to prepare advisory reports, which were distributed to participating captains (O’Keefe and DeCelles, 2013). One challenge in the bycatch avoidance system was an inability to provide accurate advice on bycatch hotspots before the start of the fishing season and in areas in which data were not available.
Yellowtail flounder catch rates and abundance are related to abiotic environmental factors such as temperature, depth, and substrate (DeLong and Collie, 2004; Simpson and Walsh, 2004; Methratta and Link, 2007) and with biotic factors such as density of co-occurring species (Hyun et al., 2014). Seasonal (DeLong and Collie, 2004; Pereira et al. , 2012; Winton et al. , 2017) and diel variation is common in yellowtail flounder catches (e.g., Casey and Meyers, 1998; Cadrin and Westwood, 2004; Walsh and Morgan, 2004; Truesdell, 2013). However, there is less information available on the relationships between bycatch of yellowtail flounder in the scallop fishery and environmental factors (Smolowitz et al. , 2012; NEFSC, 2013).
The New England Fishery Management Council (NEFMC, 2013) developed seasonal and area restrictions for the scallop fishery based on yellowtail flounder bycatch analyses by Smolowitz et al. (2012) and the Council’s Scallop Plan Development Team. Smolowitz et al. (2012) found that the bycatch rate of yellowtail flounder was greatest from August to October and that yellowtail flounder were more abundant on eastern Georges Bank. Average annual yellowtail flounder bycatch in the scallop fishery was reduced after the time-area closures were implemented (NEFMC, 2018), but the measures have not been evaluated to determine if changes in environmental variables affecting yellowtail flounder could be used to refine the closures.
We developed two types of models for predicting the location and amount of yellowtail flounder taken in the sea scallop fishery. An exploratory set of models (hereafter the “complex” models) was based on survey catch data and a relatively wide range of environmental data, including data that was not available during preparation of advisory reports for the bycatch avoidance program, and may not be routinely available for programs based on fishery-dependent data. The “simple” model was based on additional catch data and a smaller set of variables that could be incorporated into the bycatch avoidance program to predict yellowtail flounder bycatch hotspots in near real time. We evaluated both model types by cross validation to determine and compare predictive power. Finally, the simple model was used to produce prediction maps of the type used in advisory reports. The maps were mailed to participants in the bycatch avoidance program before the beginning of the fishing season to identify bycatch hotspots where captains’ reports were not available.
Materials and methods
Data
Our study focuses on the scallop fishery taking place on Georges Bank, an underwater plateau varying in depth from approximately 50–100 metres located approximately 100 kilometres off the coast of Massachusetts. Much of the bank is open to scallop fishing, with access areas (open on a restricted basis to scallop fishing for a limited number of trips) located within three closed areas (Fig. 1). We used data from three monitoring and research programs to build and validate bycatch models and prediction maps.
Data from a cooperative seasonal bycatch survey from 2011 to 2014 (Smolowitz et al., 2012) were used in building complex and simple models (Table 1). The bycatch survey was designed to provide spatio–temporal data on scallop meat yield and groundfish bycatch (Smolowitz et al. , 2012). It employed commercial scallop vessels to tow scallop survey dredges at systematic stations on Georges Bank. Weight of scallop meats and the number of yellowtail flounder were recorded for each tow along with start and end coordinates of tow, bottom water temperature, vessel speed, depth, and other factors (Smolowitz et al. , 2012; Goetting et al. , 2013; Huntsberger et al. , 2015). Weight of yellowtail flounder was calculated using the length weight relationship parameters provided by Wigley et al. (2003). A small number of tows that caught neither scallops nor yellowtail flounder (15 out of 2 158) were excluded. Substrate data are from SMAST Scallop Video Survey maps (Harris and Stokesbury, 2010). Raster values were extracted to tow locations in ArcGIS v10.2 (ESRI, 2013).

Table 1
Scallop vessel catch data from the National Marine Fisheries Service (NMFS) Northeast Fisheries Observer Program (“Observer Program”) during years 2009 through 2011 on Georges Bank were used in cross validation to test the simple models and in creating prediction maps. Location, time and date, tow duration, scallop meat weight, yellowtail flounder weight, and a smaller set of environmental factors were recorded for each haul (Table 1). Only hauls when the observer was on-watch and all data fields were complete were used. In all data sets, entries were also excluded if gear issues were recorded that were likely to affect catch (e.g., large holes).
The bycatch avoidance program data from 2010 through 2013 were included in the combined dataset used to create prediction maps based on the selected simple models. The central point of each grid cell was used as the catch location. Each data entry for the bycatch avoidance program consists of latitude and longitude of the reporting cell centroid, date, scallop meat weight, yellowtail flounder catch, and total number of tows.
Geographic coordinates (latitude and longitude) of the tow start point (or reporting cell centroid) were projected into the Universal Transverse Mercator (UTM) Zone 19 using the R package rgdal (Bivand et al., 2014). The projected coordinates (northing and easting, in metres) were used in models and maps.
Statistical Methods
A large proportion of tows from each data set contained zero yellowtail flounder (30% of bycatch survey records, 48% of observer program records, and 42% of avoidance program records). To accommodate the high occurrence of zero catches, we applied a hurdle model-based approach (e.g., Stefánsson, 1996; Maunder and Punt, 2004; Truesdell, 2013) in which the response variable (total bycatch proportion = total yellowtail catch divided by total yellowtail plus scallop catch) is modelled in two parts: a binary response and a conditional positive value response. The first part of the model uses a binomial distribution and represents the probability of catching at least one yellowtail flounder (henceforth referred to as the “bycatch probability”). Separately, the non-zero values are modelled using a beta distribution and represent the magnitude of the bycatch relative to the scallop catch (bycatch proportion) given that some bycatch occurred (henceforth referred to as the “conditional bycatch proportion model”). This two-step model gives an understanding of two parts of the bycatch process: probability of bycatch occurring (from the bycatch probability step) and the relative proportion of bycatch (from the conditional bycatch proportion step). Generalized additive models of the catch data were built using forward selection based on AIC (Akaike, 1974) and the percentage of deviance explained. K-fold cross validation scores were also used for final model selection.
Generalized additive models with the binomial family and logit link function were developed for the presence-absence component of the model. The logit function is the inverse of the logistic function, given by the following formula:
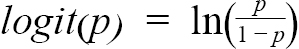
where p is the proportion of interest. For the complex model, the response variable (probability of yellowtail flounder in the catch) for tow i was modelled as:


where each f is a smooth function of the covariates associated with tow i, β0 is the intercept and other β terms are coefficients specifying the effect of the corresponding covariates, easting and northing are projected longitude and latitude, and ε is a binomially distributed error term. For the simple model, the probability of yellowtail flounder for tow i was modelled as:


where all notation is as above.
Conditional bycatch proportion was modelled using the beta distribution with logit link. The beta distribution is a flexible distribution for modelling proportions bounded between zero and one. Records with a bycatch proportion of 1 (i.e. they caught at least one yellowtail flounder and no scallops) were recoded as the next highest proportion observed. Nineteen records (0.9%) from the bycatch survey data and twenty-one records (0.5%) from the avoidance program data contained only yellowtail flounder. The next highest proportions observed in the data were 0.98 and 0.58 respectively. For the complex model, the response variable (proportion of yellowtail flounder in the catch) for tow i was modelled as:


where notation is as above except that the error term (ε) is beta distributed.For the simple model, the proportion of yellowtail flounder in the catch for tow i was modelled as:


where notation is as above except that the error term (ε) is beta distributed. We used thin plate regression splines for all one-dimensional smooth terms and tensor product smooths for all two-dimensional smooth terms (comprised of cyclic cubic regression splines for month interactions and thin plate regression splines for all other variables) in all models.
The predicted total bycatch proportion would conventionally be calculated as the product of the two predicted values (probability of bycatch times predicted magnitude of conditional bycatch proportion). However, this approach to deriving predicted values provides similar values for a high probability of small bycatch and low probability of large bycatch, which is undesirable for issuing advisories. Therefore, we present the predictions from the two model steps separately, as a probability of encounter and conditional bycatch proportion without presenting the total bycatch proportion estimated by the product of the two.
Probability of yellowtail flounder bycatch and bycatch proportions (yellowtail flounder weight divided by the total weight of yellowtail flounder plus scallop meats) were the response variables in modelling. We explored relationships of yellowtail flounder bycatch with a variety of environmental factors: tow location (management area, latitude and longitude), year, season, month, time of day, zenith angle, bottom temperature, depth, and sediment coarseness for each tow were potential explanatory variables for complex models (Table 1). Relatively simple models were explored for potential use in the bycatch avoidance program using variables limited to those that were available in the program data (em>i.e., latitude, longitude, month or season, and “area”: Nantucket Lightship Closed Area Access Area, Closed Area I Access Area, Closed Area II Access Area, open areas (Fig. 1)). Area was considered in addition to tow coordinates to capture the effect of differing management and fishing behaviour across these broad locations.
Simple and complex models were selected in two steps. The first step was to identify a subset of potential models with lowest AIC and highest percentage deviance explained. The second step used 10-fold cross validation to determine the preferred model. The model that explained the most variation in extrinsic data (based on deviance explained and mean absolute prediction error, MAPE) was selected as the best model. The data were divided into 10 test groups, and the model was repeatedly fit to a portion of the data, each time leaving out one of the test groups. Then the percentage of deviance explained and the MAPE were compared across models. MAPE is the average of the absolute difference between predictions and observations in the test data:
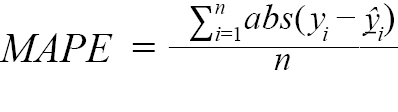
The larger the percentage deviance explained and the smaller the MAPE, the better the model explains the data. Due to differences in temporal coverage across datasets, the cross-validation step was completed for each model type (simple probability, simple proportion, complex probability, and complex proportion) fit to the survey data and to the Observer Program data separately (i.e. models were fit to a data from a single source and cross-validated with a subset from the same source then the process was repeated with data from the next source).
Results
The selected bycatch probability model included the main effects of longitude, bottom temperature, year, season, zenith angle, area and several interaction terms (Tables 2 and 3). Probability of bycatch was significantly greater in 2014 relative to 2011. There was significantly higher bycatch probability in winter relative to fall, and in fall relative to summer in Closed Area I. Probability of bycatch was greater in Closed Area II than in Closed Area I. In Closed Area II, bycatch probability was significantly lower in 2013, and significantly higher in 2014 relative to 2011. However, in the open area to the southwest, bycatch probability was significantly lower in 2012, 2013, and 2014 relative to 2011.

Table 2
Bycatch probability decreased with increasing temperature (Fig. 2A–B) and increased as zenith angle increased from 20 to 60 degrees (Fig. 2C). In the summer, bycatch probability decreased at from west to east (Fig. 2D), and the pattern is reversed in the winter with probability increasing from west to east (Fig. 2E). Bycatch probability decreased as latitude increased in the summer months (Fig. 2F). In Closed Area II as well as the open area to the southwest of Closed Area II, bycatch probability decreased at depths beyond approximately 90 m (Fig. 2G–H).
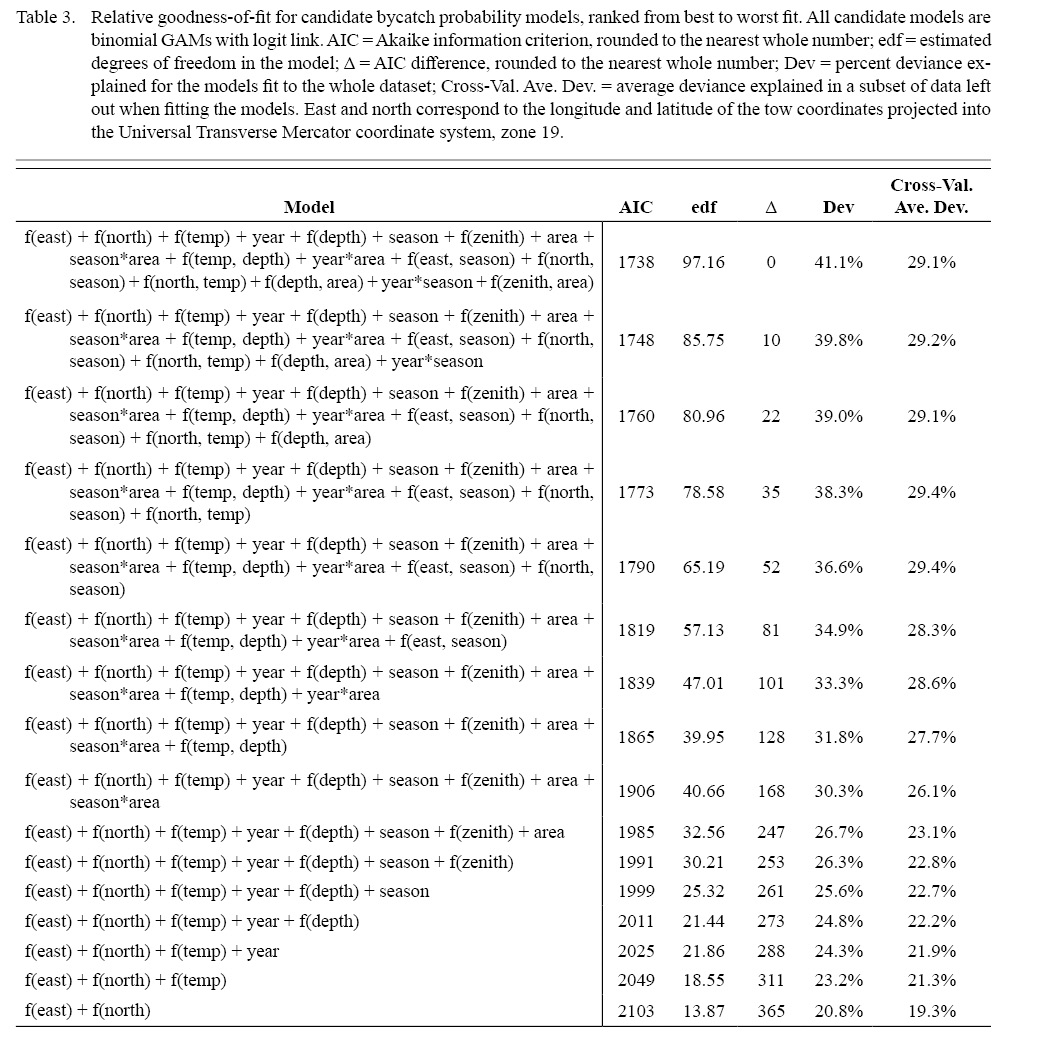
Table 3
The selected model for conditional bycatch proportion included main effects of area, latitude, longitude, bottom temperature, depth, zenith angle, year, season, and some interaction terms (Table 2 and 4). Conditional bycatch proportion increased each year from 2011 to 2014, with 2012–2014 each being significantly greater than 2011. Conditional bycatch proportion was greater in winter and lower in summer relative to the fall. Relative to Closed Area I in 2011, conditional bycatch proportion was significantly lower in most other areas in later years. Relative to Closed Area I in the fall, conditional bycatch proportion was lower in the winter in Closed Area II and the open area to the southwest. Bycatch proportion was generally greatest at the northernmost latitudes at mid-to-easternmost longitudes (Fig. 3A–C). Conditional bycatch proportion decreased slightly with increasing zenith angle (Fig. 3D). In fall, winter, and spring, conditional bycatch proportion increased with increasing latitude (Fig. 3E–G). In fall, bycatch proportion was minimized at intermediate longitude (Fig. 3H). Conditional bycatch proportion generally peaked around 12° C, with varying intensity of the peak across longitudes; highest conditional bycatch proportions were towards the east at moderate temperatures (Fig. 3I). The mean MAPE of the total bycatch proportion (translated to ratio of discarded fish to kept scallops for programmatic consistency) is 0.39 kg yellowtail flounder/kg scallops.

Fig. 2
The selected simple bycatch probability model included the main effects of longitude, latitude, and month with interactions (Tables 2 and 5). Bycatch probability generally increased from west to east, but there were significant interactions between month and longitude that indicated bycatch probability dipped mid-year at the eastern edge of the study area and peaked mid-year in the western region (Fig. 4A). Bycatch probability peaked along middle latitudes and towards east and west, with lower probability to the north and at central longitudes (Fig. 4B).
The selected simple model of conditional bycatch proportion includes longitude, latitude, month, and two- and three-way interactions and fit the data relatively well (Tables 2 and 6). Conditional bycatch proportion peaked at intermediate latitude, and the effects of latitude and longitude changed seasonally (Fig. 5).
The predicted probability of bycatch was high throughout the year in Closed Area II, generally lower in Closed Area I, and much more variable in Nantucket Lightship Closed Area (Fig. 6). In Closed Area I, bycatch probability was lowest in September and October, then increased through the winter and spring months. In Nantucket Lightship Closed Area, high bycatch probability was most widespread in August through October then contracted in December through February with a more even mix of high and low probabilities the rest of the year. The northern open area generally had low probabilities throughout the year. However, there was less data from this area than any of the other areas (Fig. 1). Predicted conditional bycatch proportion in the southern open area was subtly variable over the course of the year with higher probabilities occurring near Closed Area II.
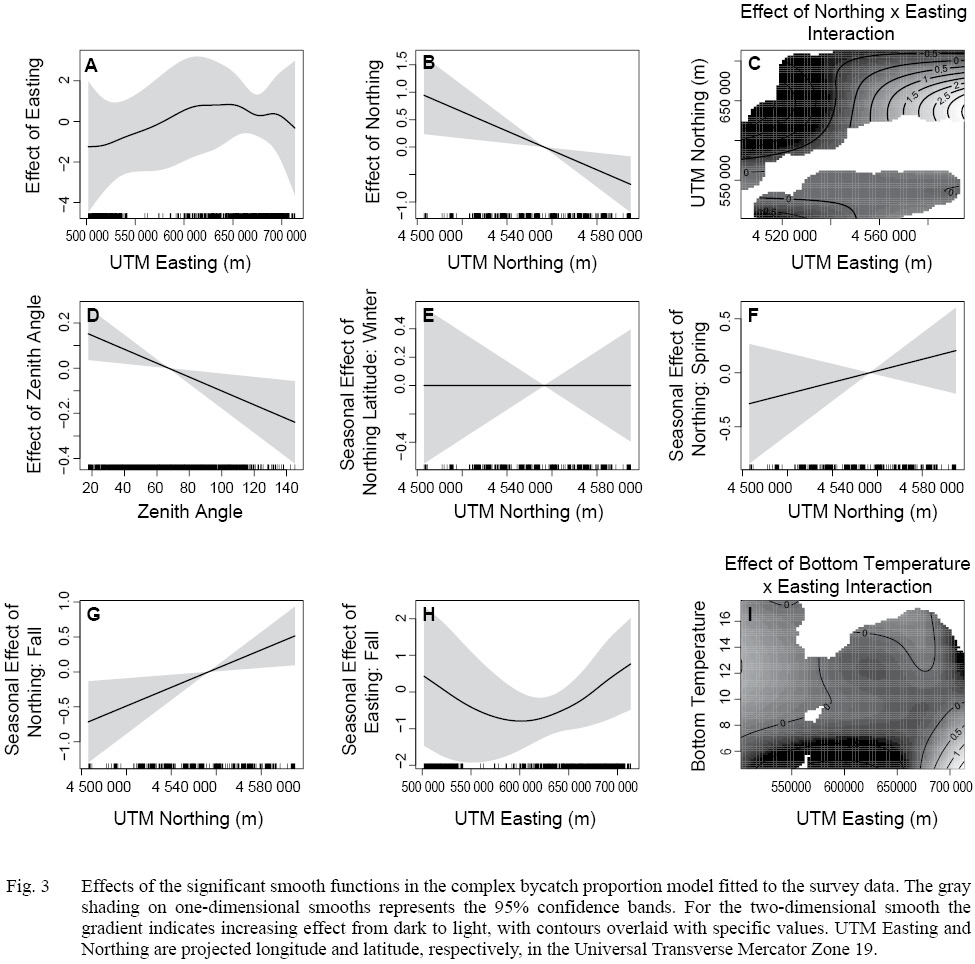
Fig. 3
Predicted conditional bycatch proportions were greatest in the northwest corner of the Closed Area II access area (Fig. 7). Conditional bycatch proportion in the southern open area was greatest during the early part of the year and decreased around June through August and increased again through the end of the year.
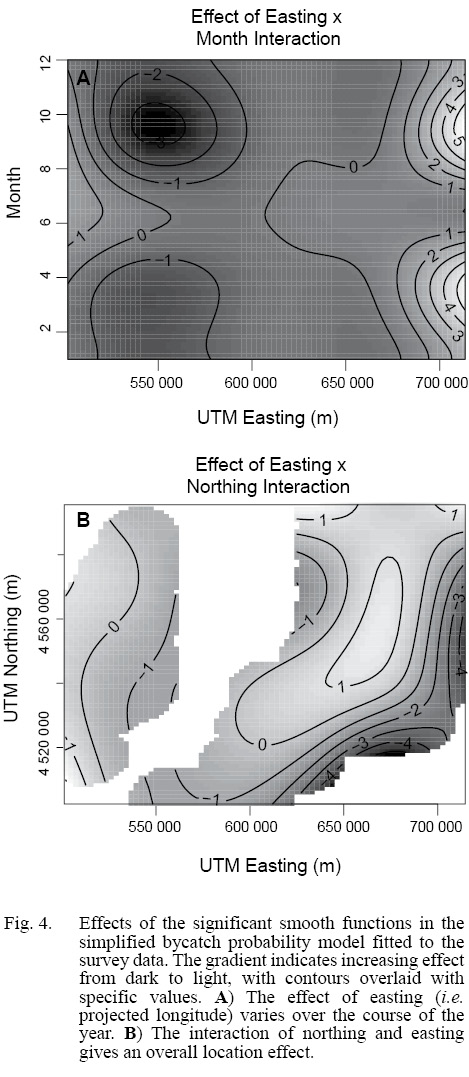
Fig. 4
In general, the simple models (both for probability and conditional bycatch proportion) performed similarly to the complex models for explaining deviance in bycatch data. Compared to the complex model, the simple bycatch probability model explained 17% less of the deviance when the model was fit to the full dataset, and cross validation average deviance explained was slightly lower for the simple model fit to survey data and slightly higher for the simple model fit to observer data compared to the complex model fit to all data (Table 2). The complex bycatch proportion model explained about 5% more deviance when the model was fit to all data than the simple model explained (Table 2). MAPE was similar for the complex model fit to all data and the simple model fit to the survey data, and the MAPE was much lower for the simple model fit to observer data than the complex model fit to all data (Table 2).
Discussion
Probability and magnitude of yellowtail flounder bycatch in the Georges Bank scallop fishery varied in space and time and with environmental variables. Similar to the findings of Helser and Brodziak (1996), DeLong and Collie (2004), and Hyun et al. (2014), the probability of catching yellowtail flounder decreased as bottom temperature increased. Depth was not a significant main effect, as it was in previous studies (e.g., Helser and Brodziak, 1996; DeLong and Collie, 2004; Truesdell, 2013), but it had significant interactions with temperature and area. Sediment type was also not a significant factor in any of the models, contrary to the findings of DeLong and Collie (2004) and Truesdell (2013). DeLong and Collie (2004) found yellowtail flounder prefer sand, sand-shell hash, and rock-sandy sediments. The lack of depth and habitat effects in our models may result from the bycatch survey being limited to the distribution of the scallop fishery and consequently including a narrower range of depth and substrate. The relative homogeneity of habitat in the scallop fishing grounds may explain why variables that would be expected to be significant predictors were not ultimately included in our selected models.
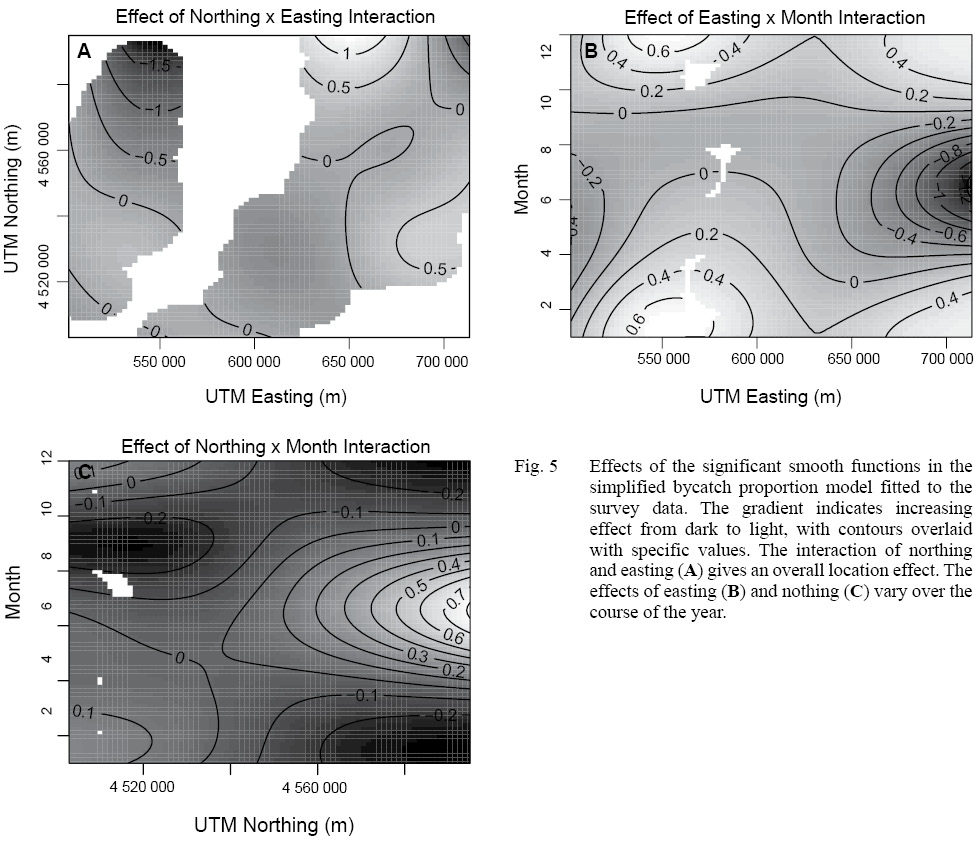
Fig. 5
Similar to our results, Helser and Brodziak (1996), and Truesdell (2013) also found seasonal effects, whereas NEFMC (2013) and Smolowitz et al. (2012) considered month instead of season. Short seasonal migrations have been documented in tagging studies (Royce et al. , 1959; Lux, 1963; Cadrin and Westwood, 2004; Wood and Cadrin, 2013). Similar to NEFMC (2013) and Smolowitz et al.(2012), we found that Closed Area II had significantly greater bycatch probability than Closed Area I, and there was a significant interaction between area and year. DeLong and Collie (2004), Simpson and Walsh (2004), and NEFMC (2013) report effects of latitude and longitude. Similarly, we found that longitude had a significant positive effect, and although latitude did not have a significant main effect, there were significant interactions of latitude with temperature and season.
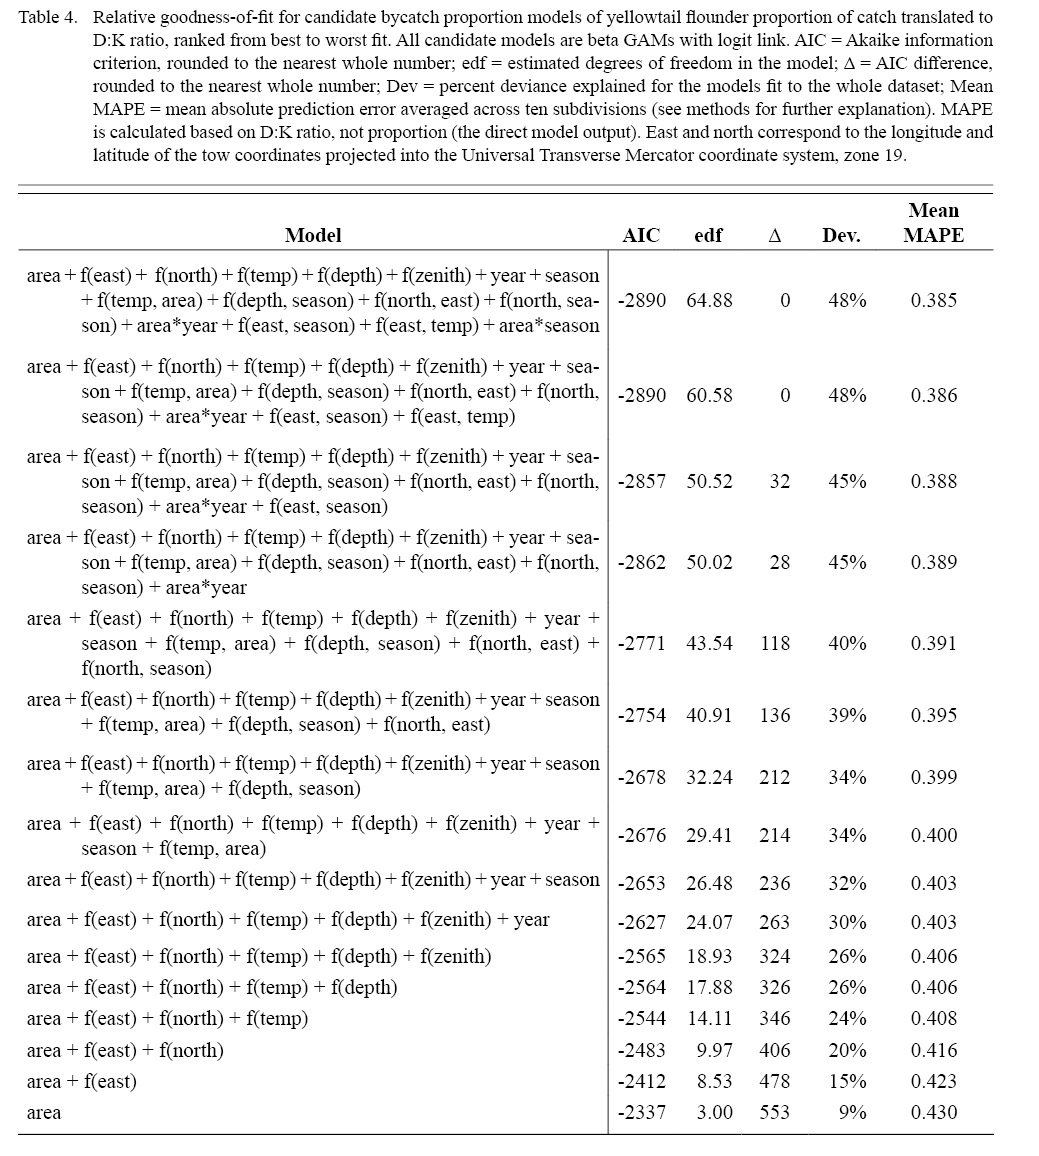
Table 4
Zenith angle had a significant positive effect, but there were relatively few observations at night, (corresponding to zenith angles between 90 and 180 degrees—zenith angle is approximately 90° at sunrise and sunset). Despite the limited range of observations, our results are consistent with Truesdell’s (2013) findings of a nearly linear positive effect of zenith angle, meaning yellowtail flounder are caught more at night. These results are also consistent with other studies that found flounders were caught more at night than during the day (Sissenwine and Bowman, 1978; Shepherd and Forrester, 1987; Walsh, 1988, 1991; Casey and Myers, 1998). A potential mechanism for this daily variability in catch is more frequent off-bottom movements at night (Cadrin and Westwood, 2004; Walsh and Morgan, 2004) and diel differences in diet of yellowtail flounder (Pitt, 1976; Langton, 1983; Collie, 1987).
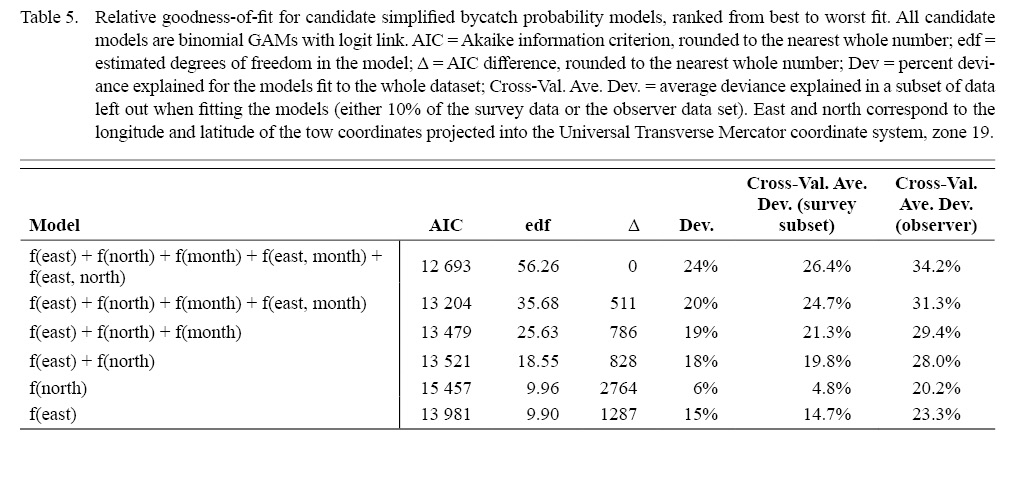
Table 5
NEFMC (2013) suggest different effects by month. In Closed Area II, peak catches were in October with smallest catches occurring May through July, and bycatch was relatively constant across months in Closed Area I and Nantucket Lightship. Smolowitz et al. (2012) found the greatest bycatch in August through October in Closed Area II. However, the response variable in these two studies was bycatch rate in numbers, rather than the proportion of yellowtail flounder in the total catch (weight) as in our model. The location effects in our models are consistent with DeLong and Collie’s (2004) model of essential fish habitat for Georges Bank yellowtail flounder, which indicated highest abundances to the east and along the southern edge of the Bank. Unlike the findings of other studies, bottom temperature and depth (e.g., Helser and Brodziak, 1996; DeLong and Collie, 2004; Simpson and Walsh, 2004; Truesdell 2013), substrate (Simpson and Walsh, 2004; Truesdell, 2013), and zenith angle (Truesdell, 2013) were not significant in the conditional bycatch proportion model, but interactions between these and other variables were significant. For example, interaction of depth and season was significant, suggesting greater proportional catches at varying depths during different seasons.
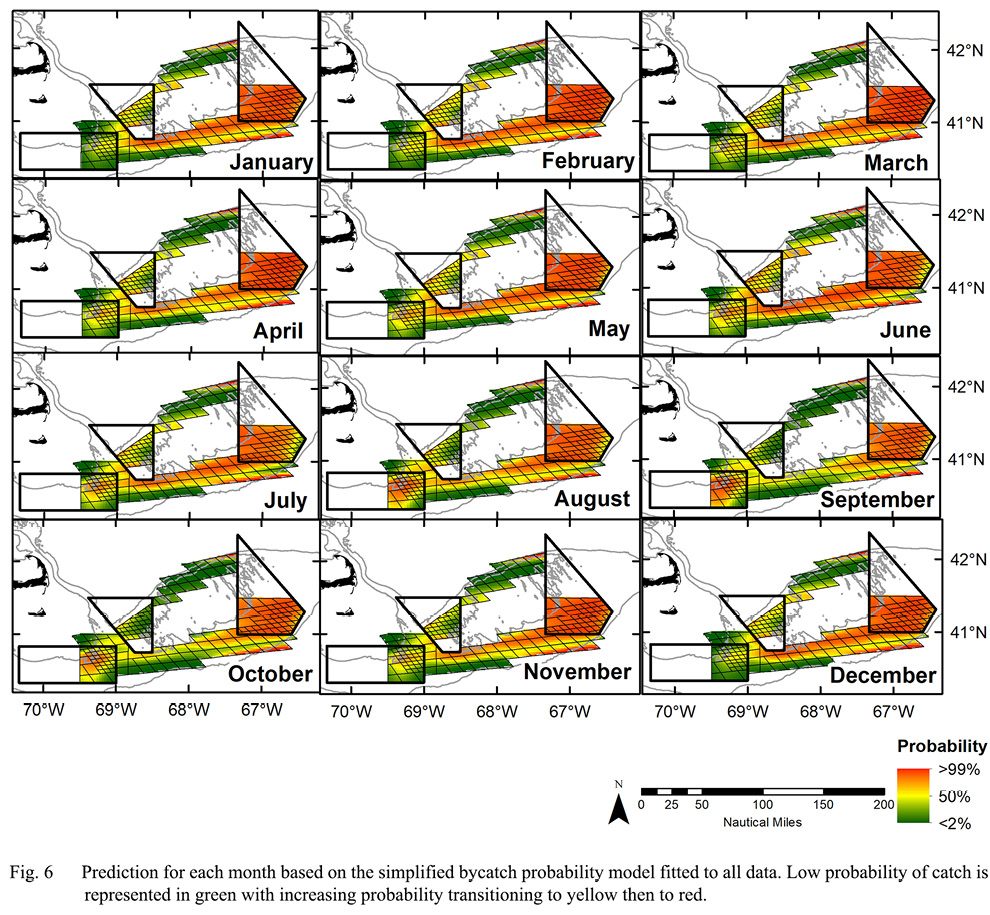
Fig. 6
Fishing behaviour and weather (e.g., wind, wave height) were not included but may have significant impacts on catch. Similarly, the abundance of predator or prey species was not examined, and biological factors could be significant determinants of yellowtail flounder abundance.
The purpose of developing simple models in addition to the complex models was to develop a useful tool for the bycatch avoidance program by using only data that is collected in the program. The ideal models combine simplicity of structure and data requirements with similar performance to the selected complex models. Each of the simple models includes only combinations of latitude, longitude, area, and month and their interactions. This is the simplest set of data requirements, and these factors may reflect underlying effects of other factors that were significant in the complex models. Statistically, relatively little is gained by including the additional environmental factors after the spatiotemporal component is accounted for, particularly in the conditional bycatch proportion models. Moreover, the numerous terms and especially interactions in the complex models make interpretation difficult.
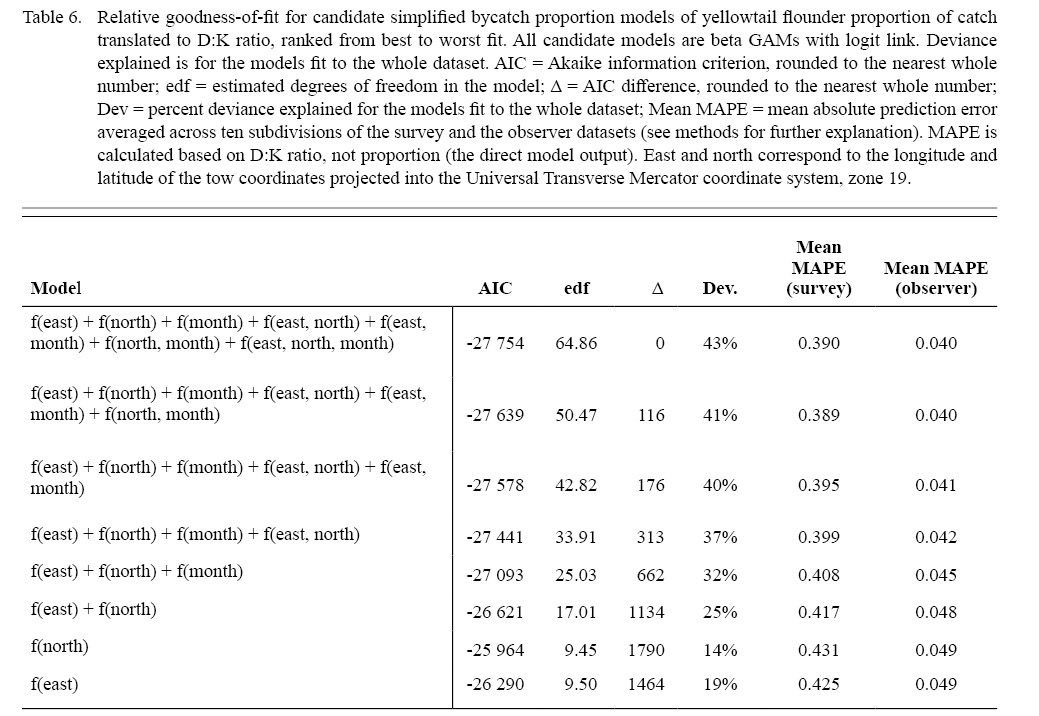
Table 6
Our approach to modelling the probability of yellowtail flounder bycatch (the bycatch probability step) and relative density of yellowtail flounder in positive tows (the conditional bycatch proportion step) is a means for providing captains with information to avoid bycatch. The outputs of both models should be considered in advising the fleet. Combining the two steps of the model through multiplication to derive an average prediction is common statistical practice (c, Truesdell, 2013; Jacobson et al., 2015) and is informative for patterns of average catch, but the combined output is not well suited for developing advisories for the scallop fleet. For example, a patchy bycatch distribution might have a bycatch probability of p = 0.10 and expected value of 0.04 kg yellowtail/ 1kg scallop meat, so the expected composite value would be 0.10*0.04 = 0.004 kg yellowtail / 1 kg scallop meat. The combined expected value is low yellowtail flounder catch. However, the more accurate and useful interpretation is that nine out of ten tows are likely to contain no yellowtail flounder, and one tow is expected to contain a large yellowtail flounder catch. Predicting the timing and location of such large bycatch events is difficult in fisheries (Bethoney et al , 2013). Captains are concerned about high bycatch events occurring when a Fisheries Observer is on board the vessel because observed discarding levels are used to estimate total fishery discards. Captains worry that a small number of tows with unusually large yellowtail flounder discards will cause the fishery level discard estimate to be high. Observer samples of bycatch ratios are expanded to the entire fishery to determine if the bycatch quota has been exceeded and if additional bycatch reduction measures (e.g., in-season closures, closed areas, gear modifications) need to be applied. In this sense, these areas of highly variable bycatch are riskier than the combined average would imply. Thus, a location with a high probability of bycatch with a low conditional proportion would be indicated in an advisory as a low-risk area, whereas a low probability of bycatch with a high conditional proportion would be indicated as a medium-risk area.
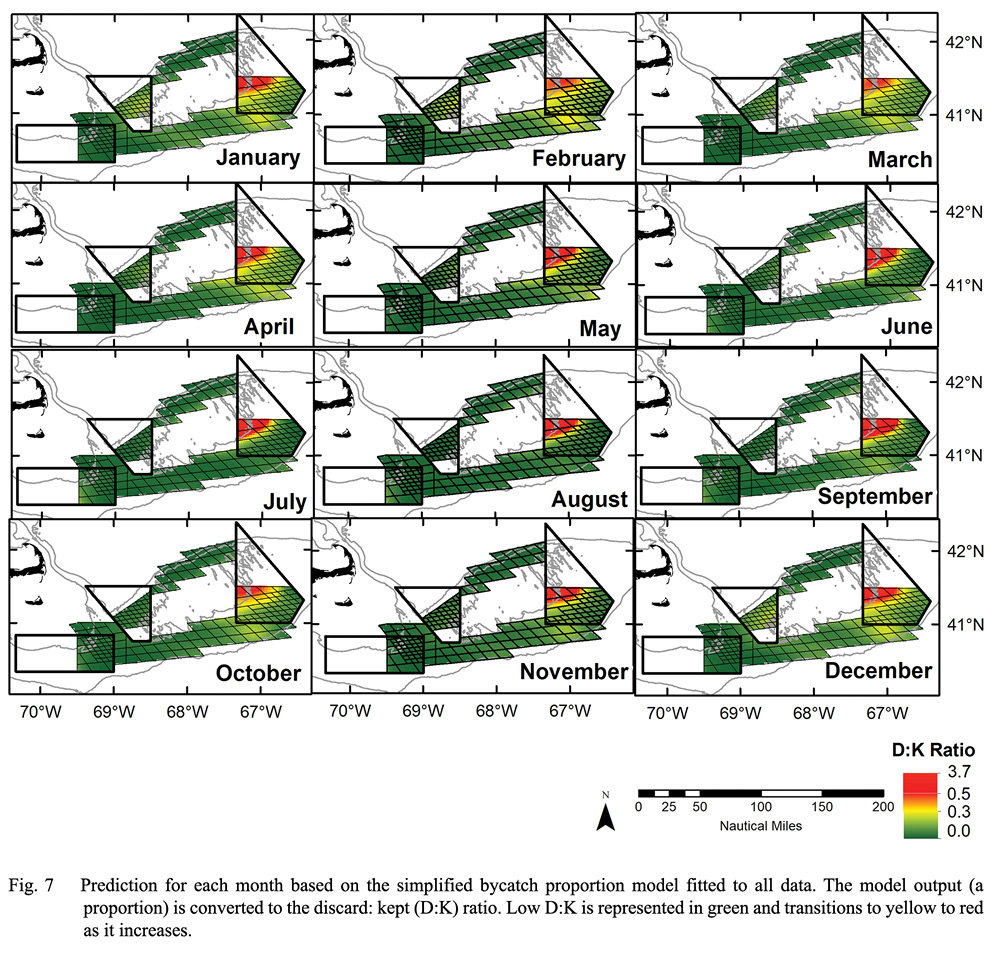
Fig. 7
The model-building methods and communication of spatial predictions through advisory maps is a useful framework for yellowtail flounder bycatch in the sea scallop fishery as well as other fisheries that face bycatch challenges. Forecasts and predictions in easy-access formats were developed for fishers to efficiently target bluefin tuna (Eveson et al. , 2015) and to avoid bycatch of loggerhead turtles (Howell et al. , 2008), alosines (Bethoney et al. , 2017), and several species in the Spanish Cantabrian Sea otter trawl fishery (Vilela and Bellido, 2015). The SMAST bycatch avoidance program functioned on a cooperative, voluntary basis. However, the models produced in this work could also be informative in the context of a formal management system. Such management considerations have been explored in other contexts (Lewison et al. , 2015), including habitat-based predictions of southern bluefin tuna catch (Hobday and Hartmann, 2006; Hobday et al. ,2011), blue marlin catch models (Walsh et al. , 2006), and theoretical move-on rules for the New England Multispecies fishery (Dunn et al. , 2014).
Predictive models are often used for supporting sustainable resource use. We demonstrate an application of such models as a component of a cooperative bycatch avoidance system. The ability to anticipate unfavourable fishing conditions (e.g., interactions with unwanted species or low density of target species) will remain an important component of sustainable fishing.
Acknowledgements
We extend thanks to Larry Jacobson for his advice throughout the project and insightful review of this paper. We also thank all of the captains and vessel owners who made the SMAST Bycatch Avoidance Program possible. We appreciate the bycatch survey data provided by the Coonamessett Farm Foundation. This work was funded through NOAA grant NA15NMF4540063 and donations from scallop fishing vessel owners.
References
Akaike, H. 1974. A new look at the statistical model identification. IEEE Transactions on Automatic Control, 19(6): 716–723. https://doi.org/10.1109/TAC.1974.1100705
Amante, C, and Eakins, B. W. 2009. ETOPO1 1 Arc-Minute Global Relief Model: Procedures, Data Sources and Analysis. NOAA Technical Memorandum NESDIS NGDC-24. National Geophysical Data Center, NOAA. https://doi.org/10.7289/V5C8276M [21 May 2014].
Bethoney, N.D, Stokesbury, K. D. E., and Cadrin, S. X. 2013. Environmental links to alosine at-sea distribution and bycatch in the Northwest Atlantic midwater trawl fishery. ICES Journal of Marine Science, fst013. https://doi.org/10.1093/icesjms/fst013
Bethoney, N. D., Schondelmeier, B. P., Kneebone, J., and Hoffman, W. S. 2017. Bridges to best management: effects of a voluntary bycatch avoidance program in a mid-water trawl fishery. Marine Policy, 83: 172–178. https://doi.org/10.1016/j.marpol.2017.06.003
Bivand, R., Keitt, T., and Rowlingson, B. 2014. rgdal: Bindings for the Geospatial Data Abstraction Library. R package version 0.8–16. Available from: http://CRAN.R-project.org/package= rgdal [Accessed 2014 October]
Caddy, J. F. 1989. A perspective on the population dynamics and assessment of scallop fisheries, with special reference to the Sea Scallop, Placopecten magellanicus (Gmelin). In: J. F. Caddy, (Ed.) Marine invertebrate fisheries: their assessment and management. New York: John Wiley & Sons. pp. 559–589.
Cadrin, S. X., and Westwood, A. D. MS 2004. The use of electronic tags to study fish movement: a case study with yellowtail flounder off New England. ICES CM 2004/K: 81. The Life History Dynamics and Exploitation of Living Marine Resources: Advances in Knowledge and Methodology.
Casey, J. M., and Myers, R. A. 1998. Diel variation in trawl catchability: is it as clear as day and night? Canadian Journal of Fisheries and Aquatic Sciences, 55: 2329–2340. doi: https://doi.org/10.1139/f98-120
Collie, J. S. 1987. Food consumption by yellowtail flounder in relation to production of its benthic prey. Marine Ecology Progress Series, 36: 205–213. doi: https://doi.org/10.3354/meps036205
DeLong, A. K., and Collie, J. S. 2004. Defining essential fish habitat: a model-based approach. Rhode Island Sea Grant, Narragansett, R.I. 4pp.
Dunn, D. C., Boustany, A. M., Roberts, J. J., Brazer E., Sanderson, M., Gardner, B., and Halpin, P. N. 2014. Empirical move-on rules to inform fishing strategies: a New England case study. Fish and Fisheries, 15(3): 359–375. https://doi.org/10.1111/faf.12019
ESRI. 2013. ArcGIS Desktop: Release 10.2. Redlands, CA: Environmental Systems Research Institute.
Eveson, J. P., Hobday, A. J., Hartog, J. R., Spillman, C. M., and Rough, K.M. 2015. Seasonal forecasting of tuna habitat in the Great Australian Bight. Fisheries Research, 170: 39–49. https://doi.org/10.1016/j.fishres.2015.05.008
Goetting, K., Thompson, K., Davis, F., Huntsberger, C., Stokesbury, K., Cadrin, S., Inglis, S., et al. 2013. Seasonal bycatch survey of the Georges Bank scallop fishery: final report prepared for the 2012 Sea Scallop Research Set-Aside. Coonamessett Farm Foundation, Inc., East Falmouth, MA. 134p.
Guisan, A., Lehmann, A., Ferrier, S., Austin, M., Overton, J.M.C.C., Aspinall, R., and Hastie, T. 2006. Making better biogeographical predictions of species’ distributions. Journal of Applied Ecology, 43: 386–392. https://doi.org/10.1111/j.1365–2664.2006.01164.x
Harris, B. P., and Stokesbury, K. D. E. 2010. The spatial structure of local surficial sediment characteristics on Georges Bank, USA. Continental Shelf Research, 30: 1840–1853. https://doi.org/10.1016/j.csr.2010.08.011
Helser, T. E., and Brodziak, J. K. T. 1996. Influence of temperature and depth on distribution and catches of yellowtail flounder, Atlantic cod, and haddock in NEFSC bottom trawl surveys. Northeast Fish. Sci. Cent. Ref Doc. 96–05e; 24 p. Available from: National Marine Fisheries Service, 166 Water Street, Woods Hole, MA 02543-1026.
Hobday, A.J., and Hartmann, K. 2006. Near real-time spatial management based on habitat predictions for a longline bycatch species. Fisheries Management and Ecology, 13: 365–380. https://doi.org/10.1111/j.1365–2400.2006.00515.x
Hobday, A. J., Hartog, J. R., Spillman, C. M., and Alves, O. 2011. Seasonal forecasting of tuna habitat for dynamic spatial management. Canadian Journal of Fisheries and Aquatic Sciences 68: 898–911. https://doi.org/10.1139/f2011-031
Howell, E. A., Kobayashi, D. R., Parker, D. M., Balazs, G. H., and Polovina, J. J. 2008. TurtleWatch: a tool to aid in the bycatch reduction of loggerhead turtles Caretta caretta in the Hawaii-based pelagic longline fishery. Endangered Species Research, 5: 267–278. https://doi.org/10.3354/esr00096
Huntsberger, C., Thompson, K., Winton, M., and Siemann, L. 2015. Seasonal bycatch survey of the Georges Bank scallop fishery: final report prepared for the 2013 Sea Scallop Research Set-Aside. Coonamessett Farm Foundation, Inc., East Falmouth, MA. 107p.
Hyun, S. -Y., Cadrin, S. X., and Roman, S. 2014. Fixed and mixed effect models for fishery data on depth distribution of Georges Bank yellowtail flounder. Fisheries Research, 157: 180–186. https://doi.org/10.1016/j.fishres.2014.04.010
Jacobson, L. D., Hendrickson, L. C., and Tang, J. 2015. Solar zenith angles for biological research and an expected catch model for diel vertical migration patterns that affect stock size estimates for longfin inshore squid (Doryteuthis pealeii). Canadian Journal of Fisheries and Aquatic Sciences, 72 (9): 1329–1338. https://doi.org/10.1139/cjfas-2014–0436
Jalali, M.A., Ierodiaconou, D., Monk, F., Gorfine, H., and Rattray, A. 2015. Predictive mapping of abalone fishing grounds using remotely-sensed LiDAR and commercial catch data. Fisheries Research, 169: 26–36. https://doi.org/10.1016/j.fishres.2015.04.009
Langton, R.W. 1983. Food habits of yellowtail flounder, Limanda ferruginea (Storer), from off the northeastern United States. Fishery Bulletin, 81: 15–22.
Lewison, R., Hobday, A. J., Maxwell, S., Hazen, E., Hartog, J. R., Dunn, D.C., Briscoe D., et al.,2015. Dynamic Ocean Management: Identifying the critical ingredients of dynamic approaches to ocean resource management. Bioscience, 65(5): 486–498. https://doi.org/10.1093/biosci/biv018
Lux, F. E. 1963. Identification of New England yellowtail flounder groups. Fishery Bulletin, 63: 1–10.
Maunder, M. N., and Punt, A. E. 2004. Standardizing catch and effort data: a review of recent approaches. Fisheries Research 70: 141–159. https://doi.org/10.1016/j.fishres.2004.08.002
Methratta E. T., and Link J. S. 2007. Ontogenetic variation in habitat associations for four flatfish species in the Gulf of Maine-Georges Bank region. Journal of Fish Biology, 70: 1669–1688. https://doi.org/10.1111/j.1095-8649.2007.01428.x
[NEFMC] New England Fishery Management Council. 2004. Final Amendment 10 to the Atlantic Sea Scallop Fishery Management Plan with a Supplemental Environmental Impact Statement, Regulatory Impact Review and Regulatory Flexibility Analysis. Newburyport (MA).
[NEFMC] New England Fishery Management Council. 2013. Framework 24 to the Scallop FMP and Framework 49 to the Multispecies FMP Including a Draft Environmental Assessment (EA), an Initial Regulatory Flexibility Analysis and Stock Assessment and Fishery Evaluation (SAFE Report). Appendix III – Development and analysis of Georges Bank access area seasonal restriction alternatives in Framework 24. Newburyport (MA).
[NEFMC] New England Fishery Management Council. 2018. Framework 29 to the Scallop FMP Including an Environmental Assessment (EA), an Initial Regulatory Flexibility Analysis and Stock Assessment and Fishery Evaluation (SAFE Report). Newburyport (MA).
O’Keefe, C. E., and DeCelles, G. R. 2013. Forming a partnership to avoid bycatch. Fisheries, 38(10): 434–444. https://doi.org/10.1080/03632415.2013.838122
O’Keefe, C. E., Cadrin, S. X., and Stokesbury, K. D. E. 2013. Evaluating effectiveness of time/area closures, quotas/caps and fleet communications to reduce fisheries bycatch. ICES Journal of Marine Science, 71: 1286–1297. https://doi.org/10.1093/icesjms/fst063
Pereira, J. J., Schultz, E. T., and Auster, P. J. 2012. Geospatial analysis of habitat use in yellowtail flounder Limanda ferruginea on Georges Bank. Marine Ecology Progress Series, 468: 279–290. https://doi.org/10.3354/meps10035
Pérez Roda, M. A. (ed.), Gilman, E., Huntington, T., Kennelly, S. J., Suuronen, P., Chaloupka, M., and Medley, P. A. H. 2019. A third assessment of global marine fisheries discards. FAO Fisheries and Aquaculture Technical Paper No. 633. Rome, FAO. 78 pp.
Pitt, T. K. 1976. Food of yellowtail flounder on the Grand Bank and a comparison with American plaice. ICNAF Research Bulletin. 12: 23–27.
Politou, C.-Y., Tserpes, G., and Dokos, J. 2008. Identification of deep-water pink shrimp abundance distribution patterns and nursery grounds in the eastern Mediterranean by means of generalized additive modelling. Hydrobiologia, 612: 99–107. https://doi.org/10.1007/s10750-008-9488-8
Rooper, C. N., Hoff, G. R., Stevenson, D. E., Orr, J. W., and Spies, I. B. 2019. Skate egg nursery habitat in the eastern Bering Sea: a predictive model. Marine Ecology Progress Series, 609: 163–178. https://doi.org/10.3354/meps12809
Royce, W. F., Buller, R. J., and Premetz, E. D. 1959. Decline of the yellowtail flounder (Limanda ferruginea) off New England. Fishery Bulletin, 59: 169–267.
Sanchez, P., Demestre, M., Recasens, L., Maynou, F., and Martin, P. 2008. Combining GIS and GAMs to identify potential habitats of squid Loligo vulgaris in Northwestern Mediterranean. Hydrobiologia, 612: 91–98. https://doi.org/10.1007/s10750-008-9487-9
Shepherd, G., and Forrester, J. MS 1987. Diurnal variation in catchability during bottom trawl surveys off the northeastern United States. ICES C.M. 1987/B: 44.
Simpson, M., and Walsh, S. 2004. Changes in the spatial structure of grand bank yellowtail flounder: Testing MacCall’s basin hypothesis. Journal of Sea Research, 51(3–4): 199–210. https://doi.org/10.1016/j.seares.2003.08.007
Sissenwine, M. P., and Bowman, E. W. 1978. An analysis of some factors affecting the catchability of fish by bottom trawls. ICNAF Research Bulletin, 13: 81–87.
Smolowitz, R., Goetting, K., Davis, F., and Ward, D. 2012. Optimizing the Georges Bank scallop fishery by maximizing meat yield and minimizing bycatch: final report prepared for the 2011 Sea Scallop Research Set-Aside. Coonamessett Farm Foundation, Inc., East Falmouth, MA. 245p.
Stefánsson, G. 1996. Analysis of groundfish survey abundance data: combining the GLM and delta approaches. ICES Journal of Marine Science, 53: 577–588. https://doi.org/10.1006/jmsc.1996.0079
TRAC. 2019. Georges Bank Yellowtail Flounder. TRAC Status Report 2019/XX. https://repository.library.noaa.gov/view/noaa/24820
Truesdell, S. MS 2013. Modelling juvenile Atlantic cod and yellowtail flounder abundance on Georges Bank and in the Gulf of Maine using 2-stage generalized additive models: a final report to the Closed Area Technical Team of the New England Fisheries Management Council. 64p.
Tserpes, G., Politou, C.-Y., Peristeraki, P., Kallianiotis, A., and Papaconstantinou, C. Identification of hake distribution pattern and nursery grounds in the Hellenic seas by means of generalized additive models. Hydrobiologia, 612: 125–133. https://doi.org/10.1007/s10750-008-9486-x
Turner, S. M., Manderson, J. P., Richardson, D. E., Hoey, J. J., and Hare, J. A. 2016. Using habitat association models to predict Alewife and Blueback Herring marine distributions and overlap with Atlantic Herring and Atlantic Mackerel: can incidental catches be reduced? ICES Journal of Marine Science, 73(7): 1912–1924. https://doi.org/10.1093/icesjms/fsv166
Valavanis, V. D., Pierce, G. J., Zuur, A. F., Palialexis, A., Saveliev, A., Katara, I., and Wang, J. 2008. Modelling of essential fish habitat based on remote sensing, spatial analysis and GIS. Hydrobiolgia, 612: 5–20. https://doi.org/10.1007/s10750-008-9493-y
Vilela, R., and Bellido, J. M. 2015. Fishing suitability maps: helping fishermen reduce discards. Canadian Journal of Fisheries and Aquatic Sciences, 72: 1191–1201. https://doi.org/10.1139/cjfas-2013-0522
Walsh, S. J. 1988. Diel variability in trawl catches of juvenile and adult yellowtail flounder on the Grand Banks and the effect on resource assessment. North American Journal of Fisheries Management, 8: 373–381. https://doi.org/10.1577/1548-8675(1988)008%3C0373:DVITCO%3E2.3.CO;2
Walsh, S. J. 1991. Diel variation in availability and vulnerability of fish in a survey trawl. Journal of Applied Ichthyology, 7: 147–159. https://doi.org/10.1111/j.1439-0426.1991.tb00521.x
Walsh, S. J., and Morgan, M. J. 2004. Observations of natural behaviour of yellowtail flounder derived from data storage tags. ICES Journal of Marine Science, 61: 1151–1156. https://doi.org/10.1016/j.icesjms.2004.07.005
Walsh, W. A., Howell, E. A., Bigelow, K. A., and McCracken, M. L. 2006. Analyses of observed longline catches of blue marlin, Makaira nigricans, using generalized additive models with operational and environmental predictors. Bulletin of Marine Science, 79(3): 607–622.
Wigley S. E., McBride, H. M., and McHugh, N. J. 2003. Length-weight relationships for 74 fish species collected during NEFSC research vessel bottom trawl surveys, 1992–99. NOAA Tech Memo NMFS-NE-171. 26 p.
Winton, M., Huntsberger, C., Rudders, D., DeCelles, G., Thompson, K., Goetting, K., and Smolowitz, R., 2017. Spatiotemporal patterns of flatfish bycatch in two scallop access areas on Georges Bank. Journal of Northwest Atlantic Fishery Science, 49: 23–37. https://doi.org/10.2960/J.v49.m710
Wood, A. D. and Cadrin, S. X. 2013. Mortality and movement of Yellowtail Flounder (Limanda ferruginea) tagged off New England. Fishery Bulletin, 111: 279–287. https://doi.org/10.7755/FB.111.3.6
J. Northw. Atl. Fish. Sci., Vol. 52: 1–18
Publication (Upload) date: 11 Jan 2021
Lowman, B.A., O’Keefe, C.E., and Cadrin, S.X. 2021. Predictive Models of Yellowtail Flounder Bycatch in the U.S. Sea Scallop Fishery on Georges Bank. J. Northw. Atl. Fish. Sci., 52: 1–18. https://doi.org/10.2960/J.v52.m723