Fecundity information is critical in determining reproductive potential of a population. Collecting fecundity data, however, can be cost prohibitive or ineffective if a sampling protocol is not well designed. Inappropriate sampling can lead to biased estimates of fecundity, which may result in biased estimate of reproductive potential. Processing egg samples tends to be time-consuming and labour-intensive. For many fish and crustacean species, fecundity is dependent on female sizes. Nevertheless, at extreme size classes, fecundity may decrease or level off due to senescence. In order to account for this maternal effect, female sample of a wide size range need to be collected for developing a complete relationship between fecundity and body sizes. Using the Gulf of Maine northern shrimp, Pandalus borealis, as an example, we evaluated two sampling strategies, simple random sampling and size-based stratified random sampling, with a different number of sampling locations and different number of animals sampled per sampling location or length interval. The study shows that both the sampling strategies, simple random sampling and size-based stratified random sampling, can generate representative samples. However, the simulation analysis suggests that when the population size distribution is skewed with a lack of large and/or small individuals, size-based stratified random sampling is preferred due to lower variation in differences of means and medians between samples and the population. This study provides a simulation framework for identifying a cost-effective sampling protocol that can improve the estimate of fecundity, leading to an improved estimate of fish population reproductive potential.
Introduction
For many crustaceans and fish species, reproductive output of a female individual tends to increase with body size as larger females have higher capacity to accommodate more eggs or offspring (Hannah et al., 1995; Hixon et al., 2014). However, the relationship between reproductive output and female body size is usually not linear. Instead, reproductive output tends to increase approximately exponentially with body size (Hixon et al., 2014; Barneche et al., 2018). At extreme size classes, however, reproductive output of a female may decrease or level off due to senescence (Shelton et al., 2012). In order to account for this maternal effect, a wide range of sizes of females should be collected for developing a comprehensive relationship between reproductive output and female body sizes in order to have a robust estimate of reproductive potential of a population (Marshall et al., 2006).
Sample sizes and locations may also influence the quality of fecundity estimates because of large variability in space and among individuals (Parsons and Tucker, 1986; Hannah et al., 1995). An insufficient number of samples may lead to underestimated or overestimated fecundity for a given size of fish. A large number of samples is usually encouraged for estimating biological traits of a population. However, collecting biological data such as fecundity can be very time-consuming and labour-intensive labouratory processes (Rogers et al., 2019). Excessive samples are not only a waste of resources, but also a source of unnecessary pressure on the population especially when the stock is in an unhealthy status. Therefore, to reach a balance between deriving robust estimates of life history traits and efficient using available resources, an appropriate sampling design is important for collecting biological samples from a population.
Based on availability of resources and samples, two sampling designs are often used to collect biological data like fecundity: simple random sampling (Collins et al., 1998; Pennington and Helle, 2011) and stratified random sampling (Hannah et al., 1995). Simple random sampling is to randomly select samples from a population. Stratified random sampling is to divide the population to more than one group (e.g. length-intervals), and to randomly select samples from each group. In general, size-based stratified random sampling is theoretically more appropriate for collecting fecundity data, as it is more likely to include samples from each classification (length intervals), thus able to establish a more complete biological database and fecundity-body size relationship over a full size range. However, it might not be feasible for some species whose gravid individuals are encountered by chance. In addition, it takes extra effort to classify each individual before randomly sampling from each stratum. In this case, simple random sampling is usually used as a default sampling strategy. Nevertheless, whether the samples collected by these two sampling schemes can be representative of the population is rarely discussed.
The Gulf of Maine (GOM) northern shrimp used to support a significant winter fishery for the New England states (ASMFC, 2018), however the shrimp fishery has been on moratorium since 2014 due to presumed recruitment failures which were perceived to be a subsequence of warming water temperature in the GOM in past several years (Richards et al., 2012; ASMFC, 2018). Recruitment is usually related to reproductive potential of a population which can be evaluated with fecundity. However, the relationship between shrimp body sizes and fecundity was estimated in more than thirty years ago using 47 ovigerous females selected for size and wholeness of the egg mass (Haynes and Wigley, 1969). These data were fitted with a parabola for estimating fecundity for females larger than 22-mm (Richards et al. 2012, ASMFC 2018): fecundity = -0.198 l2+128.81l-17821, where l is carapace length (0.1-mm). The body size-fecundity relationship estimated with the parabola was likely biased as small spawners were not included in their study and the estimated parabola equation generated negative values for fecundity when female carapace length was below 20-mm. Therefore, there is a pressing need to develop an updated fecundity database to provide more robust estimates for northern shrimp reproductive potential, which makes northern shrimp an appropriate case study.
The aim is to compare different sampling strategies for estimating fecundity for species such as northern shrimp that have maternal effects on fecundity and the number of ovigerous individuals were unevenly collected in sampling locations. The study can identify a cost-effective sampling design for collecting fecundity data, leading to improved fecundity estimation.
Materials and Methods
This study uses simulation of resampling approach to simulate different sampling strategy scenarios based on collected survey data.
NEFSC fall bottom trawl survey data
The GOM northern shrimp spawning season takes place in late summer and fall, and most females become ovigerous in fall. Therefore, the ovigerous females used for the fecundity study were sampled in the Northeast Fisheries Science Center (NEFSC) fall bottom trawl surveys which were designed for multispecies surveys in the northeast coastal areas. As the surveys are not specifically designed for northern shrimp, in the sampling location with presence of ovigerous females, the number of shrimp varied from one to several hundred among tows. Given the limited resources, it is unrealistic to process all collected shrimp. Thus, there is a need to optimize the number of sampling locations in a year and number of shrimp collected in a sampling location. Moreover, as many other species are collected in the survey, which face similar needs, the methodology developed in this survey are applicable to other species.
The northern shrimp data and tow information were collected by NEFSC fall bottom trawl surveys (Smith, 2002) from 2012 to 2016, including dorsal carapace length (DCL), life stage, date of catch, and longitude and latitude of sampling location. The DCLs of shrimp were measured to the nearest 0.1-mm, from the posterior limit of eye socket to the posterior limit of dorsal carapace (Haynes and Wigley, 1969). Only ovigerous female data were used for simulation as the ultimate goal was to collect fecundity data based on maternal body sizes.
Simulation of resampling study
Data from 2012 to 2016 were resampled separately with two sampling strategies of simple random sampling and size-based stratified random sampling. Sampling locations were randomly resampled without replacement from each year’s sampling locations for each scenario. Sampling intensity was determined by the number of shrimp of interest from a sampling location and the percentage of sampling locations in each year.
Simple Random Sampling
The sampling scenarios were considered with the percentage of sampling locations and number of shrimp sampled from each sampling location. Two potential sample sizes (i.e., 10 and 20) were considered for a sampling location in the simulation. For sampling locations with less than the required number of shrimp (i.e., 10 or 20), all shrimp in that location were used. For sampling locations with more than the specified shrimp, 10 or 20 shrimp were randomly sampled without replacement (Fig. 1)

Fig. 1
Stratified Random Sampling
For stratified random sampling, minimal and maximal lengths were determined to be the minimum and maximum DCLs of sampled collected in a year with a length interval of 1.5-mm. A given number (1 or 2) of shrimp was sampled from each length interval until no more shrimp were available in that length interval. The sampling scenarios were developed with a different sampling intensity and number of shrimp sampled from each length interval. For sampling locations which had fewer than 10 shrimp collected, all shrimp in that location were used for 1-shrimp scenarios (20 shrimp for 2-shrimp scenarios, Fig. 1)
Equivalence testing
Null hypothesis significance testing framework is commonly used in ecology to examine the differences between the two groups (Martinez‐Abrain, 2008; Beninger et al., 2012). However, it is criticized in some ecological studies for the following reasons: (1) a lack of significance (P>α) simply means there is no sufficient evidence to reject the null hypothesis, but it does not mean the null hypothesis is true (Brosi and Biber, 2009; Beninger et al., 2012; Lakens, 2017); and (2) the statistical power needed to detect a difference is low. Alternatively, two one-sided equivalence tests within a frequentist framework can be used to ascertain effect quality by specifying meaningful effect size based on biological or ecological understanding (Parkhurst, 2001; Lakens, 2017). Moreover, the lower and upper bounds constructed with a priori specified effect size allow the researchers to evaluate significant differences with reduced type II error defined in traditional hypothesis testing (Parkhurst, 2001; Brosi and Biber, 2009). Therefore, instead of using traditional null hypothesis testing, we use two one-sided equivalence testing for the simulated data in each scenario.
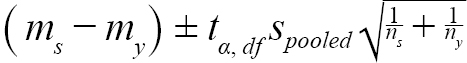
Before we performed equivalence testing, a difference of 1.5-mm (∆) was determined as the minimum effect size that we would like to detect. Effect size was defined as the magnitude of the observed difference (Beninger et al., 2012). Our data suggested that mean DCL of ovigerous females was around 25-mm, which is equivalent to an age of 3.5 years based on age-DCL growth curve (ASMFC, 2018) with age 3 being estimated at 23.5-mm and age 4 at 26.5-mm. We thus determined the effect size interval at 1.5-mm, as shrimp in DCLs smaller or larger than 1.5-mm are likely to be at a different age of years. The lower and upper bounds of equivalence intervals for each sample were constructed as (Nakagawa and Cuthill, 2007; Lakens, 2017):
 (1)
(1)
 (2)
(2)
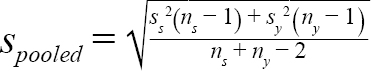
where m s = mean (or median) DCL of samples from a given scenario in year y; m y = mean (or median) DCL of all samples collected in year y; t α, df = t statistic at a significance level of α at degree of freedom at df; α = 0.05, df = n s + n y − 2 ; n s = number of samples of a given scenario; n y = number of samples collected in year y; s s = standard deviation of samples from a scenario in year y; and s y = standard deviation of all the samples collected in year y.
Two one-sided tests were performed to means and medians of samples simulated from each scenario in each year. The null hypothesis is ei l ≤ ∆ and ei u ≥ ∆, and the alternative hypothesis is − ∆ < equivalence interval < ∆, where ei l = lower bound of equivalence interval, ei u = upper bound of equivalence interval. Both components in the stated null hypothesis must be false to reject the null hypothesis. Thus, if the equivalence interval falls within the equivalence interval, the difference between the means or medians is smaller than the magnitude of effect size we specified.
Statistical power of detecting the specified effect size (∆ = 1.5-mm) was estimated with the number of samples simulated in each scenario at the significance level of 0.05. Statistical power of 0.95 was set as a reference instead of traditional 0.8, as we assume the cost of committing a type II error was the same as that of committing a type I error (Peterman, 1990; Di Stefano, 2003). Coefficient of variation (CV) was also calculated for evaluating the dispersion of samples for each simulation scenario. All analyses were performed in R 3.5.1 (R Core Team, 2018).
Results
Number of sampling locations in each year
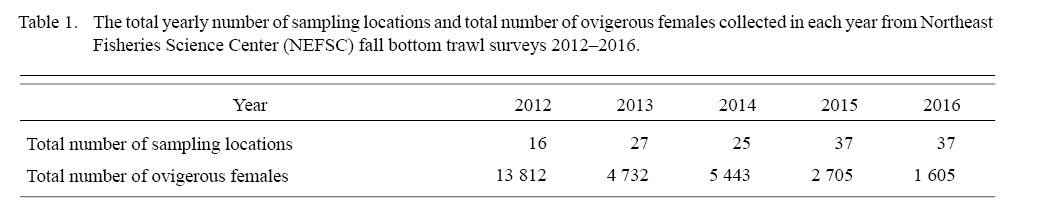
Table 1
The total yearly number of sampling locations and total number of ovigerous females collected in each year from 2012 to 2016 were shown in Table 1. Our data showed that the mean DCL of ovigerous females varied between 24.08 and 25.86 from 2012 to 2016 (Fig. 2). In addition, samples collected in 2014 deviated from normal distribution with a mean at 25.43-mm-DCL and a median of 26.5-mm-DCL, and with an unusual wide standard deviation (SD) of 2.89-mm (SD varied from 1.52 to 1.66 in the other four years).
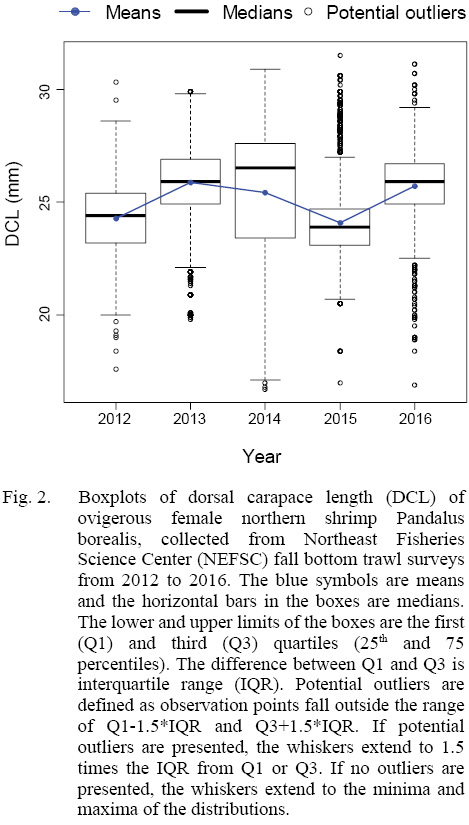
Fig. 2
Equivalence tests
The equivalence tests of means for all the scenarios showed that most equivalence intervals of means fell within the specified effect size interval when at least 20% of the sampling locations were sampled except for 2014 (Fig. 3). Similar results could be found in tests for the difference in medians (Fig. 4). The equivalence interval of medians barely fell within the effect size interval for simulated samples in 2014 even if all stations were sampled.
For means of 20-shrimp scenarios in 2014, the equivalence intervals started to fall within the specified effect size interval when more than 50% of the sampling locations were sampled. When less than 50% of the locations were sampled in 2014, both sampling strategies failed to reject the null hypothesis. However, the differences in means of simple random sampling had a wider variation than those of stratified random sampling scenarios (Fig. 3).
As for the equivalence tests of medians for 2014 samples, almost all scenarios failed to reject the null hypothesis (Fig. 4). Similar to the equivalence tests of means, when less than 50% of the locations were sampled, the median differences for random sampling method tended to have larger variations than those of stratified random sampling.
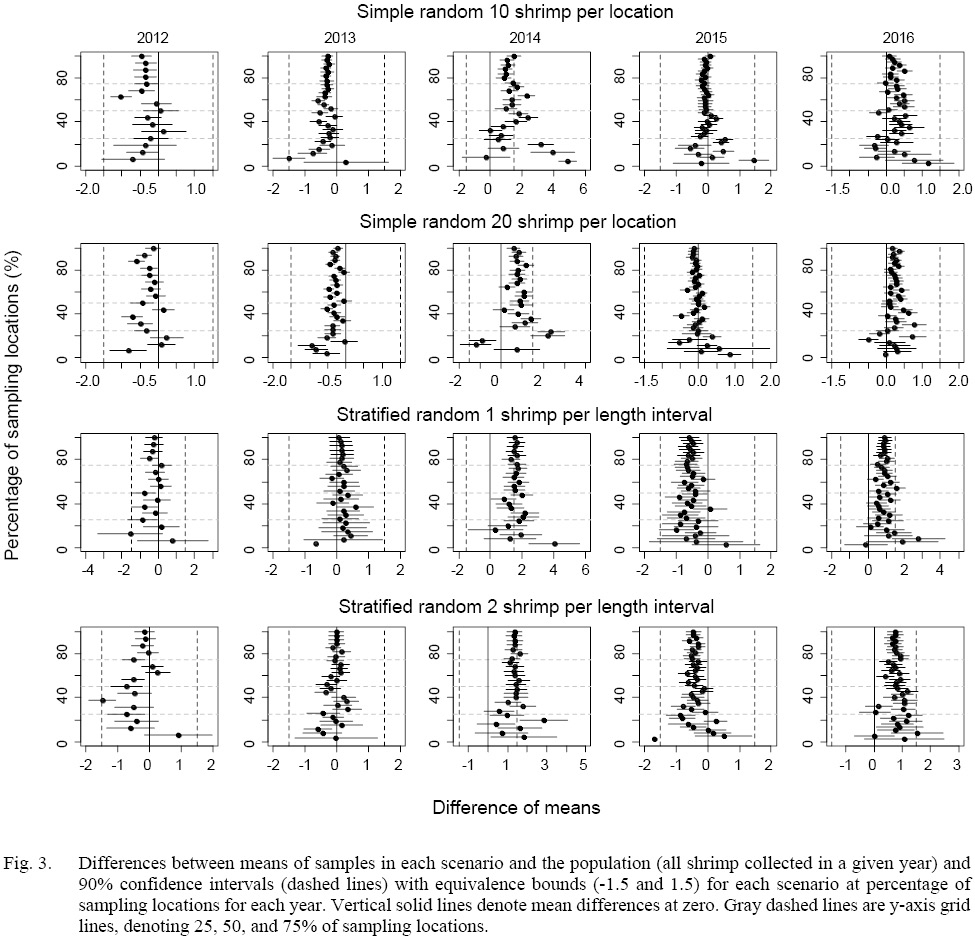
Fig. 3
Statistical power
The statistical power of detecting the minimal effect size (∆ = 1.5-mm) increased with sampling intensity, when more than 20% of sampling locations were sampled, all scenarios could reach the statistical power of 0.95 except for scenarios of 2014 (Fig. 5). Simulated samples of 2014 could reach the statistical power of 0.95 when at least 30% of the locations were sampled. There was a trade-off between the number of shrimp per location (or length interval) and percentage of sampling locations. Given a sampling strategy, more numbers of shrimp per sampling location (or length interval) could reach the statistical power of 0.95 with a lower percentage of sampling locations. The coefficients of variation were mostly below 0.1 for each scenario except scenarios in 2014 due to large standard deviation of DCL collected in 2014 (Fig. 5).

Fig. 4
Sample size
The numbers of shrimp simulated in each scenario increased with sampling intensity, and simple random sampling strategy tended to generate larger sample sizes than stratified random sampling strategy at a given sampling intensity (Figs. 5 and 6). When 20% of sampling locations were sampled, the total numbers of shrimp in the simulation for five years ranged from 129 to 349 for different strategies with different intensity (Fig. 6). When 30% of the locations were sampled, the total numbers of shrimp increased to 215–612 (Fig. 6).
The means, medians, and ranges of samples simulated in each scenario were compared with the assumed populations (samples collected from the surveys) in each year (Fig. 7). When more than 20% of the locations were sampled, the simulated samples could include the central 95% of DCL of the assumed population for both sampling strategies. When less than 50% of the location were sampled, the stratified random sampling, as expected, was more likely include the minimum and maximum of DCLs of the assumed population than the simple random sampling.
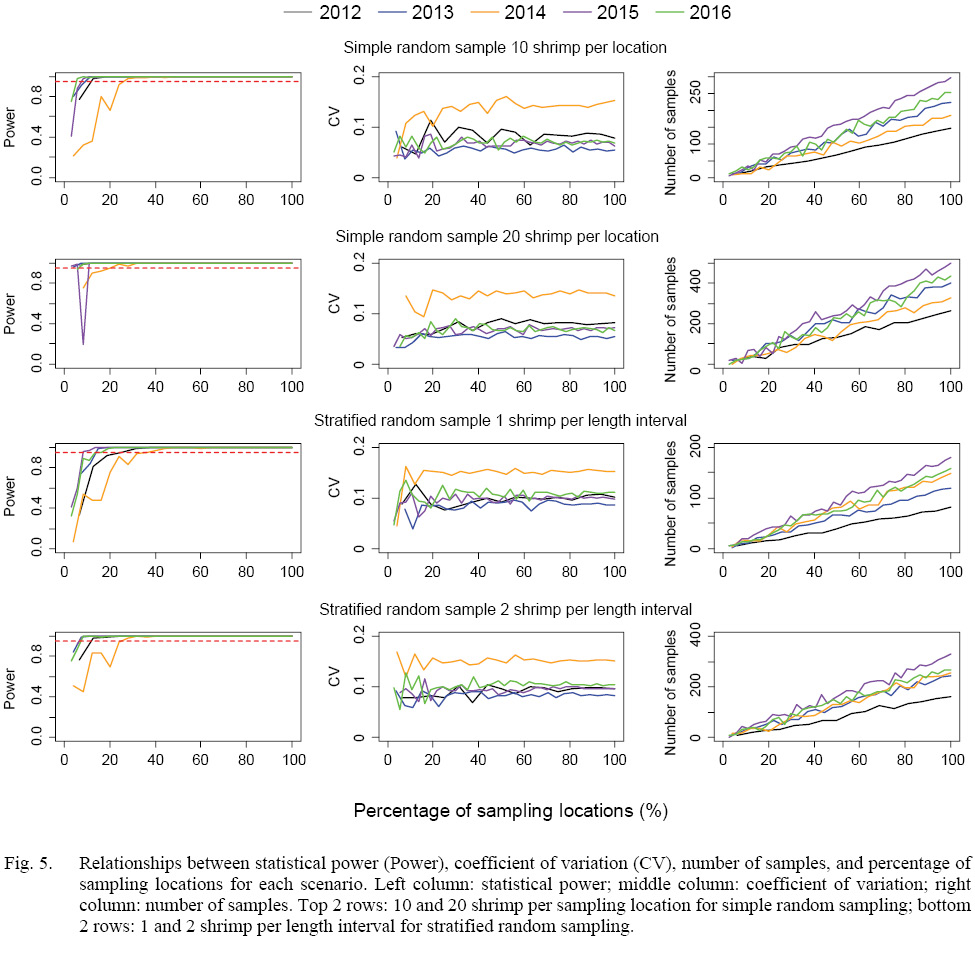
Fig. 5
Discussion
The results of equivalence testing showed that there were no large differences between samples simulated with simple random sampling and stratified random sampling strategies when the population distribution is approximately normal. Both sampling strategies can collect samples that were representative of the population (i.e., including the central 95% of the distribution) and the means and medians did not significantly differ from the specified effect size when more than 20% sampling locations were sampled. However, if we conducted traditional null hypothesis significance testing, many of the simulated samples would suggest statistical significance as the confidence interval of error did not include zero, which might not be biologically significant. The results suggested the merits of equivalence testing over traditional null hypothesis significance testing with the ability to detect a biologically meaningful or ecologically important effect size (Parkhurst, 2001; Brosi and Biber, 2009).
The number of shrimp simulated for each scenario with different strategies, in general, linearly increased with the number of sampling locations. However, as the surveys were not specifically designed for northern shrimp, number of shrimp collected at a station could be only a few. Therefore, the ultimate sampling intensity (number of shrimp simulated for a scenario) was not exactly proportional to the number of locations sampled. An extreme example was the 20-shrimp scenario with three sampling stations with simple random sampling strategy, which had only four DCLs simulated in that scenario. The statistical power was hence low (Fig. 5). Our simulation reflects the discrepancy between samples collected in multispecies surveys and ideal sampling for fecundity data. Care should be taken to adjust sampling strategy in such circumstances.
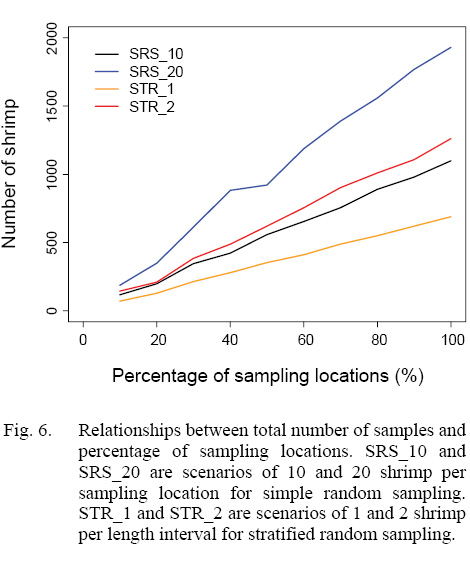
Fig. 6
Increasing sampling intensity by either raising the number of shrimp per location, length interval, or the number of sampling locations can reduce sampling error and increase statistical power. However, the cost of increasing sampling intensity may not be effective as the magnitude of precision that can be improved is trivial when sampling intensity is above a certain level (Pennington et al., 2002). Although both the sampling strategies we adopted in this study suggested that the equivalence interval can fall within the effect size interval when at least 20% of the locations were sampled (except for 2014), we determined stratified random sampling may be a more effective sampling strategy for collecting fecundity data as it requested for a low sample size compared to the simple random sampling.
With stratified random sampling at a fixed overall sampling size (number of shrimp simulated for all five years), based on the trade-off between the number of shrimp per length interval and the percentage of the locations, a desired statistical power can be achieved at a lower percentage of sampling locations for 2-shrimp per length interval scenarios. However, the stratified random sampling strategy with one shrimp per length interval is preferred in this case, as a higher percentage of sampling locations allows a broader spatial coverage of the study area. Therefore, the optimal sample size for collecting fecundity data was estimated at 215 shrimp for five years (30% of the locations) with size-based stratified random sampling.
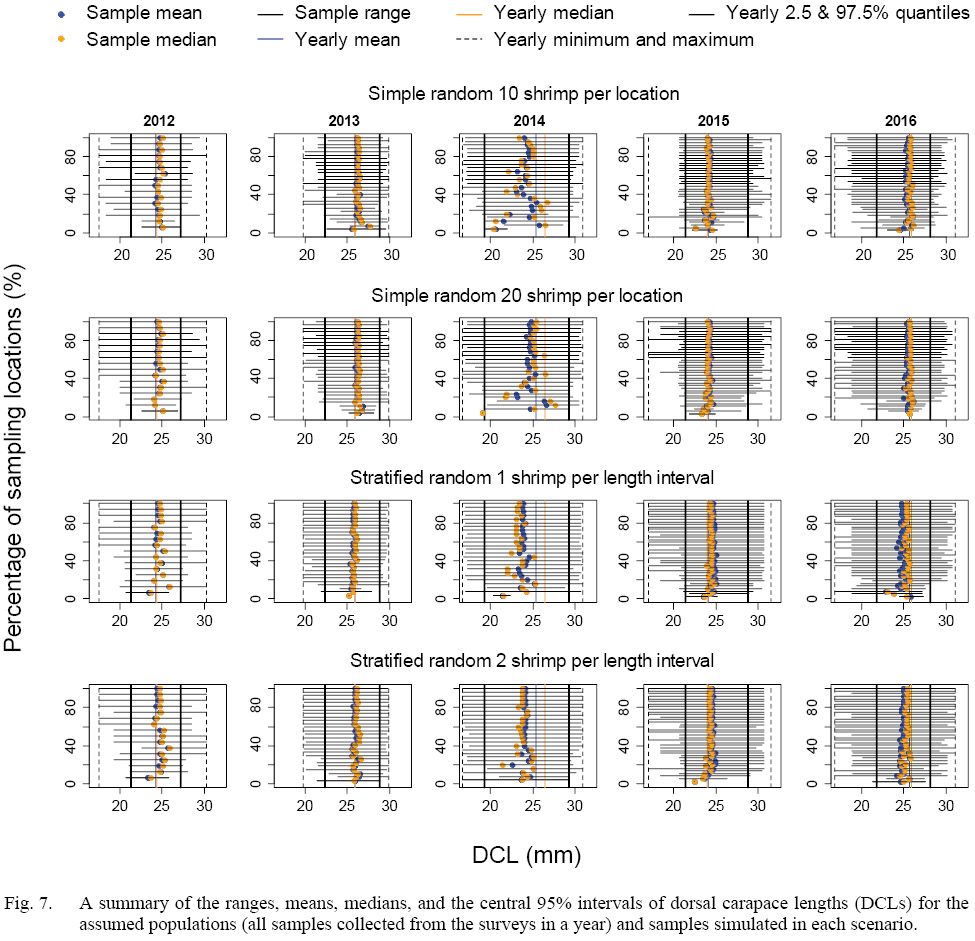
Fig. 7
Both sampling strategies generated unrepresentative samples which were significantly different from the specified effect size when less than 50% of the locations were sampled for 2014 due to the skewed distribution of DCLs in 2014. Generally, it is not possible to know the length distribution of the population which is usually assumed to be approximately normally or log-normally distributed. It should be cautioned when many small spawners are observed in the population, which could be a sign of early sexual maturity resulting from fishing pressure, environmental changes and consequent food availability to females (O’Brien, 1999; Koeller et al., 2007). Spawners at small sizes make less contribution per individual to reproductive potential of a population, as small spawners tend to produce fewer offspring per individual with lower survival rates (Shelton et al., 2012; Barneche et al., 2018).
Aanes and Volstad (2015) used simulation approach to evaluate subsampling strategies for collecting age data for Northeast Arctic cod (Gadus morhua), suggesting that length-stratified sampling is more effective than simple random sampling because length-stratified sampling can ensure a better coverage of the age composition when age data were collected from a small subsample of measured lengths of fish. Our findings agree with Aanes and Volstad (2015). For the purpose of collecting fecundity data, stratified random sampling strategy is preferred over simple random sampling when the size distribution of ovigerous females is actually skewed with many small spawners (deviated from the assumed normally distributed population). Because it is often not possible to have enough resources for a high sampling intensity, and simple random sampling is more likely to generate a biased sample in a low sampling intensity (Figs. 3, 4, and 7). Conversely, although stratified random sampling also generates biased samples, the variation of means and medians of samples are relatively stable when sampling intensity is low. Furthermore, labouratory process for collecting fecundity data can be very time-consuming and labour-intensive. The time needed for processing a shrimp to collect fecundity data is generally 3–4 hours. Given a sampling intensity of 20% of the sampling location, the 10-shrimp simple random sampling scenario generates a larger number of sample size than the 1-shrimp per length interval stratified random sampling scenario by 69 shrimp. Thus, the simple random sampling may take 207 additional hours (69 shrimp × 3 hours), which would cost additional $4140 (i.e., 207 hours × $20 per hour per person) for laboratory process alone. Our analyses suggest that length-stratified random sampling is a more cost-effective strategy for collecting fecundity data.
The shrimp samples Haynes and Wigley (1969) used for collecting fecundity data ranged from 22 to 31-mm-DCL. Our data, except for 2014, the central 95% of ovigerous females collected from the survey ranged from a similar interval of 22–28-mm-DCL in this study. However, it appeared that if shrimp outside the central 95% length interval were excluded from the regression of length and fecundity, the regressed relationship may not be able to provide reliable estimates of fecundity for the population as the fecundity-DCL relationship developed with 47 female shrimp by Haynes and Wigley (1969) generates negative numbers for shrimp at DCLs<20-mm. It suggested that, when estimating size-based fecundity for a population, (1) a complete range of size data is necessary for developing a fecundity-body size relationship; (2) several years of samples may be needed for building a complete fecundity database; and (3) parabola equation should be used with caution as it may generate biologically meaningless estimates of fecundity (negative values). Estimating the magnitude of the bias in reproductive potential of a population is beyond the scope of this study. Consequently, before we take a further step into investigation of the misestimates of fecundity, there is a pressing need to develop a new fecundity-DCL relationship with proper sampling design for collecting fecundity data.
This study proposes a simulation framework that can be used to develop a cost-effective sampling strategy for estimating fecundity data for many marine fish and crustacean species which share the characteristics of (1) a strong maternal effect on fecundity (i.e., number of offspring increase with female body sizes; Haynes and Wiley, 1969); (2) number of individuals collected varied among sampling locations and number of sampling locations varied by year; and (3) extensive length frequency data have been collected for multiple years which can be used for sampling design. Collecting fecundity data can be very time-consuming and labour-intensive. Insufficient samples may result in biased estimates; however, excess samples can be a waste of resources. Therefore, an appropriate sampling design for optimizing effective sample size is needed for building a complete fecundity data base. We advocate the use of equivalence testing and power analysis before collecting samples in order to determine biologically meaningful effect size instead of statistical significance in traditional null hypothesis significance testing.
Acknowledgements
The authors thank Northeast Fisheries Science Center for providing data. This study was financially supported by NOAA Saltonstall-Kennedy grant (NA16NMF4270245).
References
Aanes, S., and Vølstad, J. H. 2015. Efficient statistical estimators and sampling strategies for estimating the age composition of fish. Canadian Journal of Fisheries and Aquatic Sciences, 72: 938–953. https://doi.org/10.1139/cjfas-2014-0408
ASMFC NSTC (Atlantic States Marine Fisheries Commission Northern Shrimp Technical Committee). 2018. Assessment report for Gulf of Maine northern shrimp.
Barneche, D. R., Robertson, D. R., White, C. R., and Marshall, D. J. 2018. Fish reproductive‐energy output increases disproportionately with body size. Science, 360: 642–645. https://doi.org/10.1126/science.aao6868
Beninger, P. G., Boldina, I. and Katsanevakis, S. 2012. Strengthening statistical usage in marine ecology. Journal of Experimental Marine Biology and Ecology, 426–427: 97-108. https://doi.org/10.1016/j.jembe.2012.05.020
Brosi, B. J., and Biber, E. G..2009. Statistical inference, type II error, and decision making under the US Endangered Species Act. Frontiers in Ecology and the Environment, 7: 487–494. https://doi.org/10.1890/080003
Collins, L. A., Johnson, A. G., Koenig, C. C. and Baker, M. S. 1998. Reproductive patterns, sex ratio, and fecundity in gag, Mycteroperca microlepis (Serranidae), a protogynous grouper from the northeastern Gulf of Mexico. Fishery Bulletin, 96: 415–427.
Di Stefano, J. 2003. How much power is enough? Against the development of an arbitrary convention for statistical power calculations. Functional Ecology, 17: 707–709. https://doi.org/10.1046/j.1365-2435.2003.00782.x
Hannah, R. W., Jones, S. A., and Long, M. R. 1995. Fecundity of the ocean shrimp (Pandalus jordani). Canadian Journal of Fisheries and Aquatic Sciences, 52: 2098–2107. https:// doi.org/10.1139/f95-803
Haynes, E. B., and Wigley, R. L. 1969. Biology of the northern shrimp, Pandalus borealis, in the Gulf of Maine. Transactions of the American Fisheries Society, 98: 60–76. https://doi.org/10.1577/1548-8659(1969)98[60:BOTNSP]2.0.CO;2
Hixon, M. A., Johnson, D. W. and Sogard, S. M. 2014. BOFFFFs: on the importance of conserving old‐growth age structure in fishery populations. ICES Journal of Marine Science, 71: 2171–2185. https://doi.org/10.1093/icesjms/fst200
Koeller, P., Fuentes-Yaco, C., and Platt, T. 2007. Decreasing shrimp sizes off Newfoundland and Labrador—environment or fishing? Fisheries Oceanography, 16: 105–115. https://doi.org/10.1111/j.1365-2419.2006.00403.x
Lakens, D. 2017. Equivalence Tests: A practical primer for t tests, correlations, and meta-analyses. Social Psychological and Personality Science, 8: 355–362. https://doi.org/10.1177/1948550617697177
Marshall, C. T., Needle, C. L., Thorsen, A. Kjesbu, O. S., and Yaragina, N. A. ٢٠٠٦. Systematic bias in estimates of reproductive potential of an Atlantic cod (Gadus morhua) stock: implications for stock-recruit theory and management. Canadian Journal of Fisheries and Aquatic Sciences, 63: 980–994. https://doi.org/10.1139/f05-270
Martinez‐Abrain, A. 2008. Statistical significance and biological relevance: a call for a more cautious interpretation of results in ecology. Acta Oecologica, 34: 9–11. https://doi.org/10.1016/j.actao.2008.02.004
Nakagawa, S., and Cuthill, I. C. 2007. Effect size, confidence interval and statistical significance: a practical guide for biologists. Biological Reviews, 82: 591–605. https://doi.org/10.1111/j.1469-185X.2007.00027.x
O’Brien, L. 1999. Factors influencing the rate of sexual maturity and the effect on spawning stock for Georges Bank and Gulf of Maine Atlantic cod Gadus morhua stocks. Journal of Northwest Atlantic Fishery Science, 25: 179–203. https://doi.org/10.2960/J.v25.a17
Parkhurst, D. F. 2001. Statistical significance tests: equivalence and reverse tests should reduce misinterpretation. Bioscience, 51: 1051–1057. https://doi.org/10.1641/0006-3568(2001)051[1051:SSTEAR]2.0.CO;2
Parsons, D. G., and Tucker, G. E. 1986. Fecundity of northern shrimp, Pandalus borealis, (Crustacea, Decapoda) in areas of the Northwest Atlantic. Fishery Bulletin, 84: 549–558.
Pennington, M., Burmeister, L-M., and Hjellvik, V. 2002. Assessing the precision of frequency distributions estimated from trawl-survey samples. Fishery Bulletin, 100: 74–80.
Pennington, M., and Helle, K. 2011. Evaluation of the design and efficiency of the Norwegian self-sampling purse-seine reference fleet. ICES Journal of Marine Science, 68:1764–1768. https://doi.org/10.1093/icesjms/fsr018
Peterman, R. M. 1990. Statistical power analysis can improve fisheries research and management. Canadian Journal of Fisheries and Aquatic Sciences, 47: 2–15. https://doi.org/10.1139/f90-001
R Core Team. 2018. R: A language and environment for statistical computing. R Foundation for Statistical Computing, Vienna, Austria. URL https://www.R-project.org/.
Richards, R. A., Fogarty, M. J., Mountain, D. G., and Taylor, M. H. 2012. Climate change and northern shrimp recruitment variability in the Gulf of Maine. Marine Ecology Progress Series, 464:167–178. https://doi.org/10.3354/meps09869
Rogers, R., Rowe, S., Rideout, R. M., and Morgan, M. J. 2019. Fecundity of haddock (Melanogrammus aeglefinus) off southern Newfoundland. Fisheries Research, 220: 105339. https://doi.org/10.1016/j.fishres.2019.105339
Shelton, A. O., Munch, S. B., Keith, D. and Mangel, M. 2012. Maternal age, fecundity, egg quality, and recruitment: linking stock structure to recruitment using an age-structured Ricker model. Canadian Journal of Fisheries and Aquatic Sciences, 69: 1631-1641. https://doi.org/10.1139/f2012-082
Smith, T. D. 2002. The Woods Hole bottom-trawl resource survey: development of fisheries-independent multispecies monitoring. ICES Marine Science Symposia, 215: 480–488.
: Chang, H.-Y., and Chen, Y. 2020. Evaluating sampling strategies for collecting size-based fish fecundity data: an example of Gulf of Maine northern shrimp
: 33–43. https://doi.org/10.2960/J.v51.m730