J. Northw. Atl. Fish. Sci., Vol. 51: 1–13
Daniel W. Cullen (contact author)*
Department of Natural Sciences, University of Maryland Eastern Shore, Henry O. Tanner Airway Sciences Building, Building 915, 30806 University Boulevard South, Princess Anne,
Maryland 21853, USA; Phone: 410-651-6520; *Email: bwtegu@gmail.com
*Email address for contact author
Bradley G. Stevens
Department of Natural Sciences, Living Marine Resources Cooperative Science Center, University of Maryland Eastern Shore, Henry O. Tanner Airway Sciences Building, Building 915,
30806 University Boulevard South, Princess Anne, Maryland 21853, USA; Phone: 410-651-6066; Email: bgstevens@umes.edu
Cullen, D.W. and Stevens, B.G. 2020. A brief examination of underwater video and hook-and-line gears for sampling black sea bass (Centropristis striata) simultaneously at 2 Mid-Atlantic sites off the Maryland coast. J. Northw. Atl. Fish. Sci., 51: 1–13. https://doi.org/10.2960/J.v51.m725
Abstract
This study briefly examined the simultaneous use of 2 gear types, single underwater video and hook-and-line, for sampling black sea bass (Centropristis striata) in Mid-Atlantic waters off the Maryland (USA) coast. Fish were sampled from 4 July to 3 August 2012 at two locations with varying bottom habitats ranging from sand and mud to natural hard bottom. First, the relationship between estimates of abundance of black sea bass sampled with the two gear types was examined using least-squares regression analysis. Second, abundance estimates were compared using linear mixed-effects models to determine whether abundance differed between the two sampling locations. In general, positive linear relationships were found between abundance estimates produced by underwater video and hook-and-line sampling methods. Abundance estimates of fish sampled with both gears was also found to be greater for the location with more complex bottom habitat. The results suggest that, if utilized together, both gear types have the potential to provide useful information about the abundance of black sea bass in Mid-Atlantic coastal waters.
Key words: black sea bass, hook-and-line, Mid-Atlantic, simultaneous sampling, underwater video
PDF
Download Citation Data

Citation to clipboard
 Reference management software (Endnote, Mendeley, RefWords, Zotero & most other reference management software)
LaTex, BibDesk & other specific software
Introduction
Fishery-dependent data such as catch per unit of effort (CPUE) are commonly used in stock assessments given that they are assumed to be proportional to population abundance. Studies investigating the relationship between CPUE and abundance have demonstrated that the assumption of proportionality between the two does not hold true for all species or for fish caught in variable habitats and at different times (Richards and Schnute, 1986; Harley et al., 2001). The need for more accurate estimates of abundance has led to the development of fishery-independent surveys for many species (Pennington and Strømme, 1998; Rotherham et al., 2007). Surveys may adopt a variety of sampling methods to obtain abundance estimates though no methods are without bias (Willis et al., 2000; Wells et al., 2008). Differences in biases and selectivity among different sampling gears have lead to studies comparing the use of multiple gears including underwater video and hook-and-line for assessing fish abundance (e.g. Willis and Babcock, 2000; Willis et al., 2000; Parker et al., 2016).
The black sea bass (Centropristis striata) is a commercially and recreationally important fish species in the Northwest Atlantic Ocean (Moser and Shepherd, 2009). North of Cape Hatteras, NC, C. striata in Mid-Atlantic waters are migratory with individuals inhabiting inshore hard bottom (i.e. hard structurally complex habitat; Steimle and Zetlin, 2000) and reef habitats from spring to autumn and deeper offshore shelf waters during the winter (Drohan et al., 2007). Black sea bass are harvested inshore with hook-and-line and fish traps and offshore with bottom trawls (Shepherd and Terceiro, 1994). Fishery independent data used to estimate abundance for the species come from seasonal bottom trawl surveys performed by the National Marine Fisheries Service (NEFSC, 2017). However, the hard bottom habitats occupied by C. striata during its inshore residency make sampling with bottom trawl gears ineffective (Musick and Mercer, 1977). Stock assessments for the species have suggested that sampling fish on hard bottom (NEFSC, 2017) habitats with alternative gears (e.g. fish traps, hook-and-line, underwater video gears) may provide useful data for population assessment and management.
In this study, we used single remote unbaited underwater video and hook-and-line gears for sampling black sea bass simultaneously on structurally complex habitats ranging from sand and mud to natural hard bottom composed of rocky outcroppings, gravel, and boulders (Steimle and Zetlin, 2000). We hypothesized that if the two methods follow changes in abundance in the same manner, then the relationship between the two will be proportional and that both methods should produce correlated estimates of abundance when employed at the same time and location. Specific objectives were to: 1) examine the relationship between counts of black sea bass sampled simultaneously with underwater video and hook-and-line gears at sites with different types of bottom habitat, and 2) determine whether sampling with underwater video and hook-and-line gears would produce differences in counts of black sea bass at sites with different types of bottom habitat and presumed fish densities.
Materials and methods
Sample sites
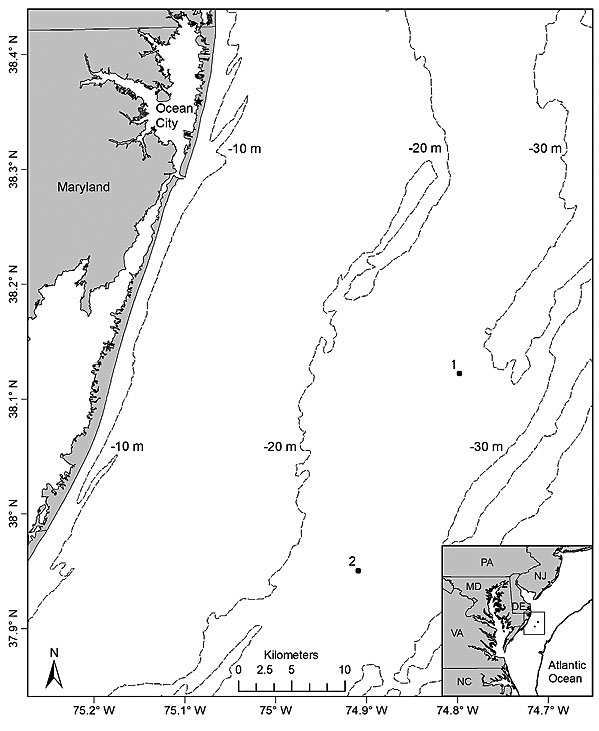
Fig. 1
Sampling took place on 8 days from 4 July to 3 August 2012 at 2 sites located off the Maryland coast (Fig. 1). To compare underwater video and hook-and-line gears for sampling black sea bass, 2 sites (separated by 20.3 km) were chosen based on their types of bottom habitat. Site 1 (37°59′14″N, 74°54′30″W) was characterized by a sandy bottom with mud, shell, gravel, and aggregations of small to large cobbles and was classified as an unstructured site. In contrast, site 2 (38°09′09″N, 74°47′41″W) was classified as highly structured since it consisted of a mixture of sand, mud, cobbles, large rocks, and low relief hard bottom habitat [i.e. rocky outcroppings and boulders or other structures partly covered with sea whips (Leptogorgia spp.) and stony corals]. The choice of sites (i.e. site 1 = unstructured; site 2 = structured) allowed for a simultaneous comparison of the two gears for sampling black sea bass on variable habitats with presumed differences in fish densities. Sites were visited separately on alternate days for a total of 4 times each during the study period. Sampling took place during daylight hours from 0900 to 1600 Eastern Daylight Savings Time at depths ranging from 29 m to 31 m at both sites. Bottom water temperatures varied from 12.8°C to 14.4°C and 11.7°C to 14.6°C at site 1 and site 2, respectively.
Video sampling and video processing
Underwater videos were collected using a rectangular (91 cm length × 61 cm width × 91 cm height) video system constructed of galvanized and zinc plated slotted steel angle along the top, 5.1 cm wide slotted square corner posts, and 3.8 cm wide slotted square side and center bars (Fig. 2A). The main camera consisted of a Canon FS-30 camcorder with a wide angle lens in an Equinox HD-6 underwater housing mounted in the center (58 cm from the bottom of the frame). The camera housing was tilted in a slightly downward facing position that provided the camera with standardized view of the bottom habitat (see Fig. 2B and 2C for examples) and fish when present. A strip of slotted steel flat was wrapped around the housing to help secure it in place. Three backup GoPro HD Hero 1 cameras (720-pixel resolution, 170° angle of view) in underwater housings were faced outward at slight angles (to match the position and direction of the central mounted main camera) from the right and left sides and the back of the frame.
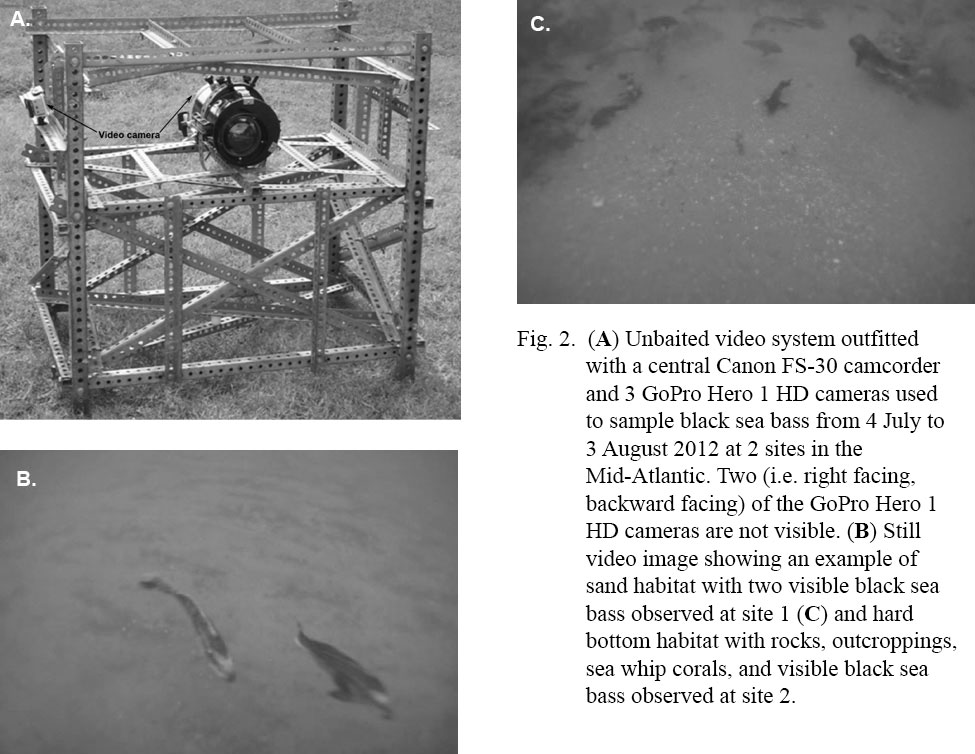
Fig. 2A-C
Eight 40 min unbaited video system deployments (i.e. the system was deployed without a bait source) were made at a site on each sampling date. Deployments of the system were conducted by first locating a soft sediment area on the bottom using a fish finder (FCV-582L; Furuno Electric Co. Ltd., Nishinomiya City, Japan); soft sediment areas were identified prior to deployments to ensure that the video system did not land on rocks or other bottom structures when present. The system was then lowered to the bottom slowly with a polypropylene rope that was affixed to a surface buoy. After 40 min, the system was lifted to the vessel with a hydraulic pot-hauler. The vessel was moved ~20 m from the first deployment location and deployed for the next sample; camera batteries were changed after four deployments of the system. Because water current may influence counts of fish on videos (Bacheler et al., 2016), near-bottom current velocity (m s-1 was measured during deployments with a SeaHorse Tilt Current Meter (SeaHorse TCM; OkeanoLog, North Falmouth, MA; Sheremet, 2010) mounted to a nearby deployed fish trap. Further, since overhead cloud cover could potentially reduce natural lighting on the bottom and affect the ability to observe and count fish on videos, cloud cover (%) at each site was recorded during each deployment. Cloud cover (%) was determined on a given sampling day by visually estimating the percentage of sky covered by clouds directly above the vessel. Estimates ranged from 0% to 100% with 0% indicating no cloud cover and 100% indicating absolute cloud cover while values falling within the range represented partly to mostly cloudy conditions.
In the laboratory, videos were processed using a standard video editing software (Adobe Premiere Pro CS5, vers. 5.0; Adobe Systems Incorporated, San Jose, CA). Generally, videos from the main camera were selected for processing however on one occasion (18 July) fogging of the underwater housing made them unsuitable for viewing. In this case, videos from one of the backup cameras were randomly selected for processing. We chose a 30 min video interval for counting because the highest observations of fish occurred within the first 15 min of video (Cullen and Stevens, 2017). Counts for black sea bass were made using the MeanCount counting method (Schobernd et al., 2014). MeanCount is the mean across counts of fish observed in a sample of frames from the video (Schobernd et al., 2014); here, 60 single frames were sampled systematically, one every 30 s for 30 min of video. We selected MeanCount over other video counting metrics commonly reported in the literature including MaxN (i.e. the maximum count of individuals of a focal species observed at a single time point on the video; Campbell et al., 2015) because Schobernd et al. (2014) found it to both have similar variation to MaxN and scale linearly with true abundance. However, during processing, MaxN values were noted at a single time point on each video to serve as a reference for the peak number of fish observed on videos. The video system was allowed to settle on the bottom for the first ~60 s or more of video before counting was initiated.
Hook-and-line sampling
Hook-and-line sampling was conducted concurrently with video sampling using 6 ft (1.8 m) PENN Mariner one piece fiberglass fishing rods and PENN 209 Level Wind reels (Penn, Philadelphia, PA) equipped with 30 lb (13.6 kg) monofilament line. While drifting over a site, three fishers were assigned a fishing position (1, 2, or 3) on the starboard side of the boat (Harms et al., 2010). Each fisher simultaneously dropped a 3 hook (size = 3/0 Mustad octopus hooks; O. Mustad & Son A.S., Gjovik, Norway) sampling rig assembled with barrel swivels, a 0.23 kg lead sinker, and bait (northern shortfin squid, Illex illecebrosus whole squid were sliced into 5–8 cm strips. Four hook rig drops were made by each fisher for a maximum bottom time of 3 min per hook rig drop though lines could be retrieved prior if a bite was felt or to avoid losing hooked fish. On few occasions, the maximum soak time was exceeded due to bottom snags, line tangles, or gear issues. Fishing occurred adjacent to the deployment sites of the video system. Because hook rig drops on top of or over the system could have resulted in hook snags, we made four drifts adjacent to the deployment site. While fishing, a stopwatch was used to record the timing of four different events including when the sinker hit the bottom, when the first bite was felt, when retrieval of the hook rig commenced, and when the rig reached the surface (Harms et al., 2010). Upon retrieval, each hook rig was inspected and information pertaining to fish catches, bait (bait remaining, no bait), and hook loss resulting from bottom snags was recorded. All fish caught were identified to species prior to release.
Data analysis
A total of 64 (n = 32) video system deployments and 768 (n = 384 per site) hook rig drops were made during the study period. Estimates of CPUE (hereafter referred to as hook-and-line CPUE) for black sea bass sampled with hook-and-line gear were calculated as the number of fish caught per 3 min drop of a 3 hook rig. Values were averaged across the three fishers to obtain a single hook-and-line CPUE value corresponding to each video system deployment (n = 32 for each site; n = 8 per day).
First, the precision of untransformed estimates of MeanCount (hereafter referred to as video CPUE) and hook-and-line CPUE were compared using the relative standard error [(RSE = Standard error/mean) * 100; equation obtained from Newman et al., 1997)]. Second, relationships between untransformed video CPUE and hook-and-line CPUE and cloud cover (%) and current velocity (m s-1 were examined with Spearman’s rank correlation tests (Sokal and Rohlf, 1995). Third, we used least squares regression analysis to examine whether the relationship between video CPUE and hook-and-line CPUE estimates was linear or non-linear (Bacheler et al., 2013a). Prior to any analyses, data were checked for normality and variance homogeneity and log-transformed by taking the base 10 logarithm of the variable (video CPUE; hook-and-line CPUE) + 1 (i.e., log10[X + 1]); we added 1 to video CPUE and hook-and-line CPUE estimates because the data contained some values of 0 for both variables. Log-transformations of the data were used to meet the normality and variance homogeneity assumptions of the least squares regression and other parametric statistics when used (Sokal and Rohlf, 1995; Cullen and Stevens, 2017). The relationship between log10-transformed estimates of video CPUE and hook-and-line CPUE were examined using data for each site individually (n = 32) and pooled (n = 64) (Kulbicki, 1988; von Szalay et al., 2007). Further, the relationship between log10-transformed estimates of video CPUE and hook-and-line CPUE averaged by site and date (n = 8) was also examined. First, we assessed whether the relationship between log10-transformed estimates of video CPUE and hook-and-line CPUE was nonlinear with the quadratic model log10(hook-and-line CPUE + 1) = a + b * log10(video CPUE + 1) + c * log10(video CPUE+ 1)2 where a is the y intercept and b, and c are constants. Here, if the c parameter was found to be significantly different (P <0.05) from 0, we concluded that there was evidence of a non-linear relationship between log10-transformed estimates of video CPUE and hook-and-line CPUE (Bacheler et al., 2013b). If the c parameter was found to not differ significantly from 0, a linear model with the form log10(hook-and-line CPUE + 1) = a + b * log10(video CPUE + 1) was fitted to the data. The assumptions of normality, variance homogeneity, and autocorrelation were checked for model validation. All models were fitted using the stats package (R Core Team, 2018) in RStudio, vers. 1.1.442 (RStudio Team, 2018).
Lastly, linear mixed-effects models were used to test for differences in estimates of video CPUE between sampling sites and estimates of hook-and-line CPUE between sampling sites (Cullen and Stevens, 2017). Models included log10-transformed video CPUE (i.e. log10[video CPUE + 1]) or log10-transformed hook-and-line CPUE (i.e. log10[hook-and-line CPUE + 1]) as the response variable, site as a fixed effect, and sampling date as a random effect because multiple non-independent video system deployments and hook rig drops were conducted on each sampling date. Linear mixed-effects models were fitted with restricted maximum likelihood using the ‘nlme’ (Pinheiro et al., 2018) package in RStudio (RStudio Team, 2018). Analysis of variance was used to extract the F values and Wald test P values for the fixed effect (i.e. sampling site) (Cullen and Stevens, 2017).
Results
In total, black sea bass were observed on videos obtained from 60 (93.8%) of the 64 video system deployments (site 1 = 30, site 2 = 30) while at least 1 black sea bass was caught during 359 (46.7%) of the 768 [site 1 = 85 (22.1%), site 2 = 274 (71.4%)] hook rig drops. The frequency of videos collected during video system deployments with 0 observations of black sea bass, corresponding to hook rig drops with 1 or more black sea bass caught, was 0 for both site 1 and site 2, respectively. Conversely, the frequency of hook rig drops with 0 black sea bass caught, corresponding to videos with 1 or more black sea bass observations, was 3 for site 1 and 24 for site 2.
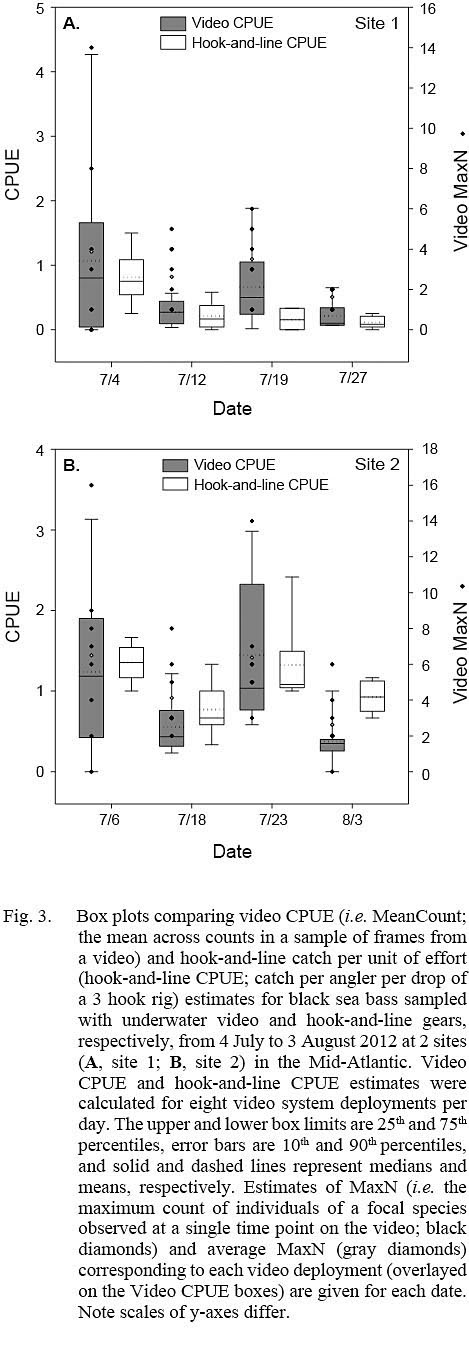
Fig. 3
The total number of black sea bass caught with hook-and-line gear at site 1 and site 2 was 124 and 421, respectively. Other species caught with hook-and-line gear included bluefish (Pomatomus saltatrix; n = 18) and summer flounder (Paralichthys dentatus; n = 2).
Estimates of video CPUE and hook-and-line CPUE were variable by site and date but were generally greater for site 2 (Fig. 3A, 3B). Values of MaxN, noted for each video deployment, also varied by site and date and ranged from 0 to 14 fish (mean ± standard error = 2.906 ± 0.486) for site 1 and 0 to 16 fish (mean ± standard error = 4.906 ± 0.618) for site 2 (Fig 3A, 3B); MaxN data were not considered further for analyses. Comparably, untransformed video CPUE estimates had greater variances and lower precision than those of untransformed hook-and-line CPUE (Table 1). Cloud cover (%) values ranged from 0 to 90% (mean ± SD = 17.375 ± ٢١.٥١١%) for site 1 and 0 to 75% for site 2 (mean ± SD = 25.156 ± 27.104%), while current velocity (m s-1 ranged from 0.050 to 0.300 m s-1 (mean ± SD = 0.319 ± 0.096 m s-1 and 0.049 to 0.178 m s-1 (mean ± SD = 0.087 ± 0.032 m s-1 for site 1 and 2, respectively. The Spearman’s rank correlation analyses produced a significant correlation between video CPUE estimates and cloud cover (ρ = -0.268; P < 0.05) but not current velocity (ρ = -0.062, P > 0.05) while hook-and-line CPUE was not significantly correlated with cloud cover (ρ = -0.091, P > 0.05) or current velocity (ρ = -0.227, P > 0.05).
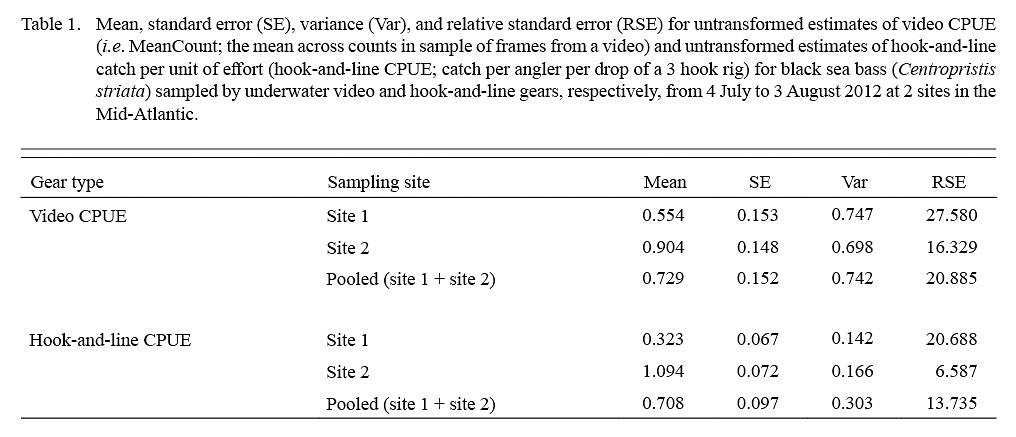
Table 1
Evidence of a non-linear relationship, indicated by a significant P value for the c parameter, between video CPUE and hook-and-line CPUE estimates was found only for site 1 data (quadratic model; parameter estimate ± standard error, a = 1.279 ± 0.478, b = -0.767 ± 0.299, c = 0.159 ± 0.030; P <0.05, R2= 0.199) (Fig. 4). Positive linear relationships were found for the site 2 data (linear model; slope ± standard error = 0.149 ± 0.056, P = 0.093, R2 = 0.091), pooled data (site 1 + site 2; linear model; slope ± standard error = 0.223 ± 0.099, P = 0.028, R2 = 0.075), and data averaged by site and date (linear model; slope ± standard error = 0.867 ± 0.308, P = 0.031, R2 = 0.569) (Fig. 4).
The linear mixed-effects models indicated that only estimates of log10-transformed hook-and-line CPUE were significantly different between sites (Table 2; Fig. 5). The variance for the residuals and standard error of the random effects around the population intercept were small for both models. The intraclass correlation coefficients (ICC = [Intercept SE] / [Intercept SE + Residual variance]; Zurr et al., 2009) denoted the presence of low to intermediate correlations between video CPUE and hook-and-line CPUE values from the same sampling days (Table 2).
Discussion
This study is the first to use underwater video and hook-and-line gears for sampling C. striata simultaneously in Mid-Atlantic coastal waters. In general, our results indicated that abundance estimates for black sea bass sampled with underwater video and hook-and-line gears differed between sampling sites with different types of bottom habitat. We chose two sampling locations, one unstructured site with sand, shell, gravel, and cobbles and another structured site with a mixture of habitat types ranging from sand to boulders and rocky outcroppings colonized with emergent epifauna, and presumed that higher black sea bass densities would be associated with greater habitat complexity. Both underwater video and hook-and-line gears produced higher video CPUE and hook-and-line CPUE estimates at site 2 with more complex bottom habitat. This result is not unexpected as higher richness and diversity of reef fish have been reported for habitats with greater complexity (e.g. Schobernd and Sedberry, 2009; Bacheler et al., 2013a). In the Mid-Atlantic, higher abundances of fish including black sea bass have been reported to correlate with greater coverage by the sea whip L. virgulata on artificial reefs (Schweitzer and Stevens, 2019). However, little information on the types and intricacies of natural black sea bass habitats has been documented. Even so, Fabrizio et al. (2013) examined seasonal habitat associations of black sea bass in a temperate site off the coast of New Jersey and found that fish preferred relatively shallow areas with coarse materials including gravel, rocks, and outcroppings over deeper (>27.5 m) areas and those with finer sediments. Additionally, black sea bass numbers increased as bottom complexity increased. Our results and those of Fabrizo et al. (2013) suggest that more intricate habitats in the Mid-Atlantic may support larger numbers of black sea bass. Accordingly, further inshore studies examining the use of underwater video or hook-and-line gears for sampling black sea bass in the Mid-Atlantic should be focused in areas with greater habitat complexity.
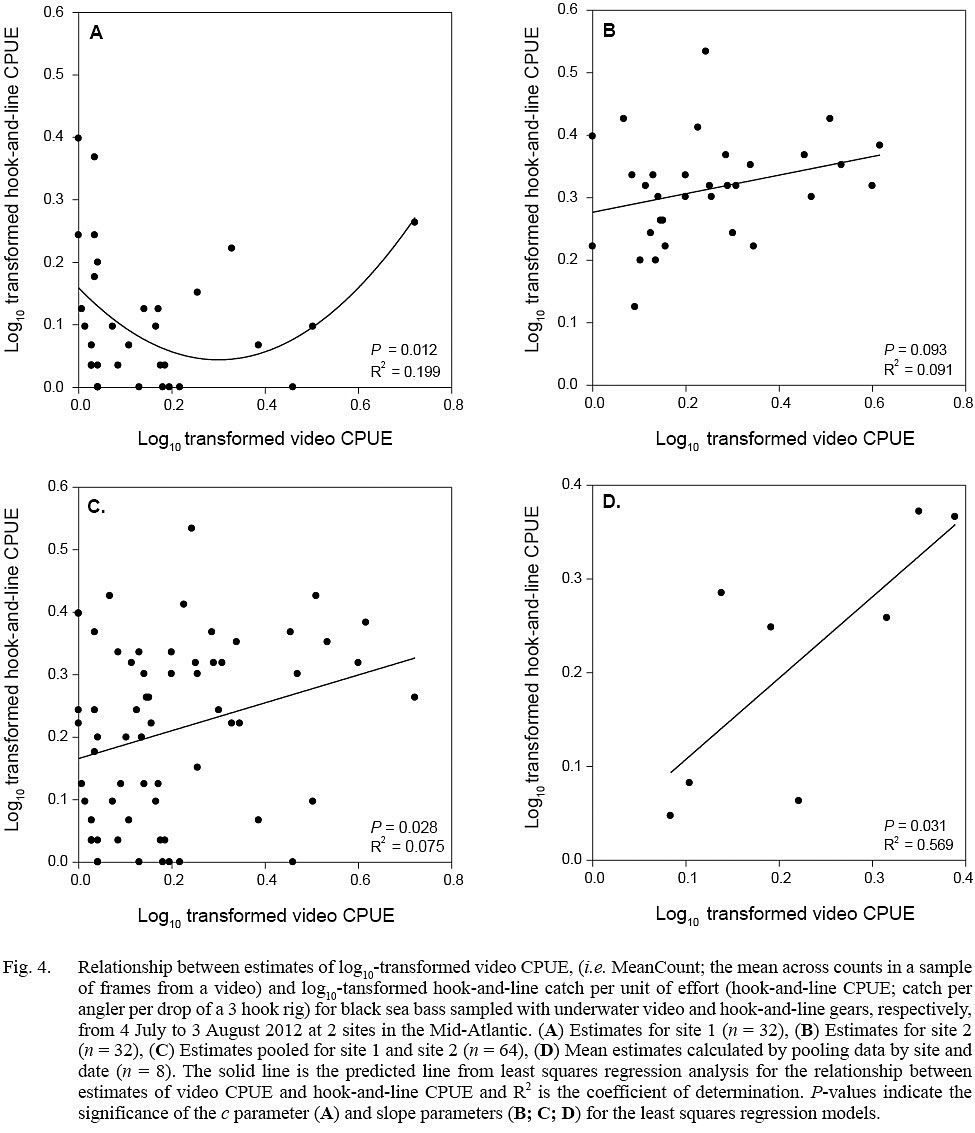
Fig. 4
In most cases, positive linear relationships between video CPUE and hook-and-line CPUE estimates were found, however, values of video CPUE were more variable and less precise than those for hook-and-line CPUE for both sites and the pooled site data. This result could be due to our sampling approach. First, because sampling with hook-and-line gear required the use of bait, simultaneous sampling with underwater video gear may have attracted fish to or away from the video system during any given deployment (Bacheler et al., 2017). This could have resulted in more variability in video CPUE values among subsequent samples. Second, although both methods were conducted simultaneously, the use of underwater video gear involved deploying the video system at a fixed location while sampling with hook-and-line gear included hook rig drops while drifting over a site. Before each video system deployment, the captain positioned the vessel over bottom habitat however it was not possible to control where the video system landed. Based on our videos, when the frame landed far from structure fewer black sea bass were observed than when it landed closer (Cullen and Stevens, 2017). The opposite occurred when fishing since we encountered fish as we drifted over the site. Though catch was not certain, the probability may have increased or decreased as we passed over different structures. Faster drifts over a site may have also limited the time that baits were on the bottom and available to fish. Additionally, the duration of sampling differed for the two gears as video system deployments were at least 30 min while the total time for 4 hook-and-line gear samples was ~12 min. Hook rig drops were also constrained to three fish per angler while video counts were not restricted. We based our hook-and-line fishing trials on methods described in a study by Harms et al. (2010) in which five hook rig drops were made while drifting over various sampling locations. In our case, anchoring the vessel adjacent to the deployment location of the video system instead of drifting and fishing continuously for the same time interval as video system deployments may have produced estimates of hook-and-line CPUE that were more analogous to video CPUE values. Anchoring, however, may result in declining catches as fish are removed from the immediate area. Based on this, we recommend that hook-and-line sampling be conducted either while drifting or anchoring and the resulting hook-and-line CPUE estimates be compared to video CPUE values collected over the same time interval. In the case of anchoring the vessel, the underwater video system should be deployed for 30-min or more prior to sampling with hook-and-line gear to reduce the likelihood of removing fish from the area and out of the view of the cameras.
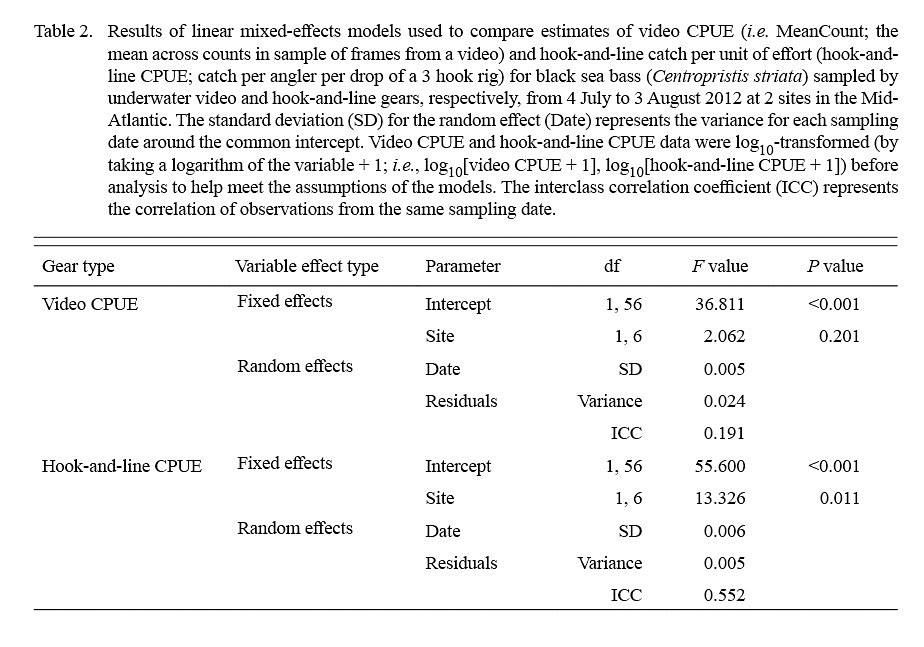
Table 2
There were some limitations to our sampling approach that may have influenced our results. First, the simultaneous use of the two gears for sampling black sea bass likely impaired the sampling independence of each gear. For example, the bait used during hook-and-line sampling could have easily attracted fish away from the video system during deployments (Bacheler et al., 2017). Conversely, fish may have been attracted away from the bait to the video system during deployments if individuals viewed the structure of the video system as an additional or new source of habitat (Cullen and Stevens, 2017). Second, we observed several factors that affected the ability of both gears to sample black sea bass. The daily variation observed (Fig. 3A, 3B) for both video CPUE and hook-and-line CPUE, could partly be related to environmental factors. Current velocity, which may affect fish swimming behavior around the camera frame (Gerstner, 1998) as well as the exposure time of bait on the bottom while fishing (Harms et al., 2010), was negatively correlated with video CPUE and hook-and-line CPUE though neither correlation was significant. However, the success of hook-and-line sampling was occasionally (~15% of hook rig drops) affected by water current velocity and surface winds as we drifted over a given sampling site. Faster water currents and stronger winds caused the vessel to drift at higher rates which reduced the bottom exposure time of the bait thereby resulting in lower catches during some hook rig drops. Conversely, video CPUE estimates were influenced more by cloud cover as indicated by the weak significant negative correlation between video CPUE and cloud cover. At the depths we sampled (29 to 31 m), cloud cover can decrease the amount of natural light that reaches the bottom (Cullen and Stevens, 2017). For deployments with cloud cover greater than 50% (n = 3), visibility and the range of observable area around the camera frame was slightly reduced by ~2 m. However, it did not affect our ability to correctly identify and count black sea bass or to identify the types of bottom habitat appearing in the camera field-of-view. The variable pattern in counts between successive sampling days may also be related to tides and/or lunar cycle as these factors have been found to have an influence on the catch rates and behavior of a variety of species (e.g. Arendt et al., 2001; Poisson et al., 2010). A preliminary examination of video CPUE and hook-and-line CPUE plotted against tidal data for the sampling period revealed no discernible relationships. Further, additional mechanisms, including the behavioural response of fish to vessel noise as well as changes in diel fish activity patterns may influence the performance of both gears (Willis et al., 2006; De Robertis and Handegard, 2013). Moreover, size selectivity of hooks and density dependent competition for baited hooks may also have an effect on estimates of hook-and-line CPUE (Ralston, 1990; Millar and Willis, 1999; Kuriyama et al., 2019). Overall, failure to find strong correlations between counts and environmental factors (i.e. cloud cover, current velocity) may be due to the short duration of our study and small sample sizes. For that reason, further sampling is needed over a longer time period to truly evaluate the influence of environmental variables including lunar cycle on black sea bass CPUE estimates obtained from both underwater video and hook-and-line sampling.
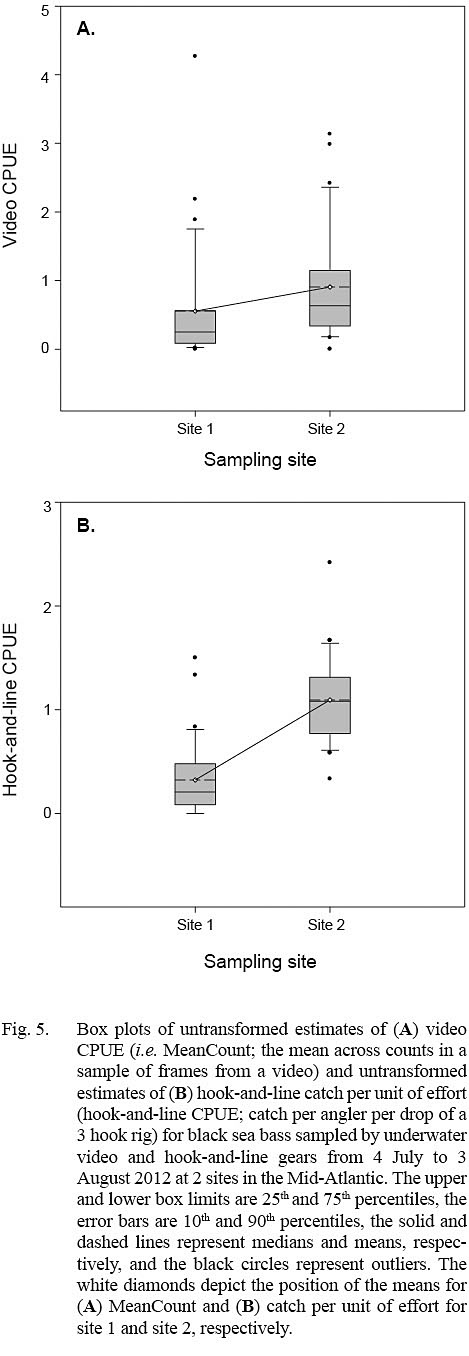
Fig. 5
In this study, we used a video counting method that estimated the average number of fish (i.e. MeanCount) observed in a series of video frames over a 30 min period of video (i.e. 60 single frames were sampled systematically, one every 30 s for 30 min of video). In recent years, the MeanCount metric has been used as an estimate of reef fish abundance in several studies conducted in the Mid- and Southeast Atlantic continental shelf regions of the United States (e.g. Bacheler et al., 2013a; Bacheler and Shertzer, 2015; Bacheler et al., 2016; Bacheler et al., 2017; Cullen and Stevens, 2017). While the use of MaxN (i.e.highest count of individuals of a species observed at a single point during a video segment) is more commonly documented in the literature, we chose MeanCount because it was reported by Schobernd et al. (2014) to have similar variation to MaxN and scale linearly with changes in true abundance. In addition, Schobernd et al. (2104) found that MaxN had an asymptotic relationship with true abundance and its use may result in abundance estimates that are biased downward for fish populations with increasing abundance or upward for fish populations with decreasing abundance. Oppositely, a comparison of the two metrics by Campbell et al. (2015) found that MeanCount had lower precision than MaxN and underestimated the proportion of positive abundance estimates for eight species of reef fish in the Gulf of Mexico. However, Campbell et al. (2015) did find evidence of a linear relationship between MeanCount and true abundance and a non-linear relationship between MaxN and true abundance using individual based models that simulated fish spatial movements. To address the non-linearity, the authors concluded that the relationship between MaxN and abundance may become linear if the area viewed by the cameras is expanded to cover a wider spatial area around the video system. Additionally, Campbell et al. (2015) suggested that, if multiple cameras are attached to the system, synced, and their videos viewed at the same time, a linear relationship between MaxN and true abundance could be obtained. In our study, we selected videos from a single camera for counting fish in order to estimate MeanCount values. Though we did make a note of MaxN for each video, the values were not included in the data analyses because we did not count fish from the entire area surrounding the video system. Therefore, we concluded that MeanCount was the better metric to use for our data since MaxN may not have shared a linear relationship with black sea bass abundance at each sampling site. However, we do believe the accuracy and precision of the two metrics for counting and estimating the abundance of black sea bass on inshore habitats should be evaluated in the Mid-Atlantic at various locations with different population densities (Stobart et al., 2015). Future studies employing underwater video sampling methods for the species should utilize multiple synchronized cameras that view a wider region around the video system so that both metrics could be estimated correctly for comparison. Their values could also be compared further with other CPUE indices obtained from hook-and-line and/or fish trap sampling (Harvey et al., 2012).
In conclusion, our results indicated that both gear types were capable of sampling the same depths and were able to detect differences in abundance estimates over a small temporal and spatial scale though each had its own advantages and limitations with regard to sampling black sea bass. For example, our single unbaited video system was simple and relatively inexpensive to build, easy to deploy and haul from depth, needed little maintenance or attention while sampling, and provided a way to obtain direct video observations of fish behavior and bottom habitats. However, processing videos and recording fish observations in the laboratory was time consuming and required large amounts data storage space. In contrast, sampling with hook-and-line gear was easy to implement with low-cost equipment and produced less variable abundance estimates but required fresh bait and multiple individuals to sample and record catch information. Hook-and-line sampling also afforded the option of collecting fish size information and biological samples but occasionally caused mortality due to deep hooking and/or barotrauma (Bugley and Shepherd, 1991). Considering the strengths of each gear type, it is recommended that both be used in combination when sampling black sea bass on a range of inshore habitats. Similarly, the sampling limitations of each gear, including the effects of cloud cover and current velocity, provide further evidence that their combined use for sampling black sea bass is warranted. Underwater video could overcome the effects of decreased bottom exposure time of bait due to increased current velocity or wind speed during hook-and-line sampling. In contrast, hook-and-line sampling could provide estimates of CPUE when cloud cover or water turbidly limits bottom lighting and visibility during video system deployments. However, despite the benefits of combined sampling, additional studies are needed to evaluate the sampling efficiencies of both gear types over greater temporal and spatial scales to determine if either could be employed as a survey tool for assessing black sea bass abundance in Mid-Atlantic waters. With larger sample sizes, future studies could evaluate the power of each gear’s ability to detect changes (e.g. minimum % change, effect size % increase or decrease) in CPUE estimates over space and time as well as between locations with different bottom habitats (Willis et al., 2003; Bennett et al., 2009; Harvey et al., 2012).
Acknowledgements
The authors thank the boat captains who helped with sampling. Thanks to the students who assisted with data collection and anonymous reviewers whose comments improved the manuscript. Financial support for this work was provided by the NOAA Educational Partnership Program with Minority-Serving Institutions (EPP/MSI; FY 2016 Award #NA16SEC4810007) through the NOAA Living Marine Resources Cooperative Science Center at the University of Maryland Eastern Shore.
References
Arendt, M. D., Lucy, J. A., and Evans, D. A. 2001. Diel seasonal activity patterns of adult tautog, Tautoga onitis, in lower Chesapeake Bay, inferred from ultrasonic telemetry. Environmental Biology of Fishes 62: 379–391. https://doi.org/10.1023/A:1012266214143.
Bacheler, N. M., Geraldi, N. R., Burton, M. L., Muñoz, R. C., and Kellison, G. T. 2017. Comparing relative abundance, lengths, and habitat of temperate reef fishes using simultaneous underwater visual census, video, and trap sampling. Marine Ecology Progress Series 574: 141–155. https://doi.org/10.3354/meps12172.
Bacheler, N. M., Schobernd, C. M., Schobernd, Z. H., Mitchell, W. A., Berrane, D. J., Kellison, G. T., and Reichert, M. J. M. 2013a. Comparison of trap and underwater video gears for indexing reef fish presence and abundance in the southeast United States. Fisheries Research 143: 81–88. https://doi.org/10.1016/j.fishres.2013.01.013.
Bacheler, N. M., Schobernd, Z. H., Berrane, D. J., Schobernd, C. M., Mitchell, W. A., and Geraldi, N. R. 2013b. When a trap is not a trap: converging entry and exit rates and their effect on trap saturation of black sea bass (Centropristis striata). ICES Journal of Marine Science 70: 873–882. https://doi.org/10.1093/icesjms/fst062.
Bacheler, N. M., Schobernd, Z. H., Berrane, D. J., Schobernd, C. M., Mitchell, W. A., Teer, B. Z., Gregalis, K. C., and Glasgow, D. M. 2016. Spatial Distribution of reef fish species along the southeast US Atlantic coast inferred from underwater video survey data. PLoS ONE 11: e0162653. https://doi.org/10.1371/journal.pone.0162653.
Bacheler, N. M., and Shertzer, K. W. 2015. Estimating relative abundance and species richness from video surveys of reef fishes. Fishery Bulletin 113: 15–26. doi:10.7755/FB.113.1.2.
Bennett, R. H., Götz, A., Sauser, W. H. H., Cowley, P. D., and Palmer, R. M. 2009. Optimization of underwater visual census and controlled angling methods for monitoring subtidal temperate reef fish communities. African Journal of Marine Science 31: 277–287. https://doi.org/10.2989/AJMS.2009.31.3.1.989.
Bugley, K., and Shepherd, G. 1991. Effect of catch-and-release angling on the survival of black sea bass. North American Journal of Fisheries Management 11: 468–471. https://doi.org/10.1577/1548-8675(1991)011<0468:MBEOCA>2.3.CO;2.
Campbell, M. D., Pollack, A. G., Gledhill, C. T., Switzer, T. S., and DeVries, D. A. 2015. Comparison of relative abundance indices calculated from two methods of generating video count data. Fisheries Research 170: 125–133. https://doi.org/10.1016/j.fishres.2015.05.011.
Cullen D. W., and Stevens, B. G. 2017. Use of an underwater video system to record observations of black sea bass (Centropristis striata) in waters off the coast of Maryland. Fishery Bulletin 115: 408–418. doi:10.7755/FB.115.3.10.
De Robertis, A., and Handegard, N. O. 2013. Fish avoidance of research vessels and the efficacy of noise-reduced vessels: a review. ICES Journal of Marine Science 70: 34–45. https://doi.org/10.1093/icesjms/fss155.
Drohan, A. F., Manderson, J. P., and Packer, D. B. 2007. Essential fish habitat source document: black sea bass, Centropristis striata, life history and habitat characteristics, 2nd ed. NOAA Tech. Memo. NMFS-NE-200, 68 p.
Fabrizio, M. C., Manderson, J. P., and Pessutti, J. P. 2013. Habitat associations and dispersal of black sea bass from a mid-Atlantic Bight reef. Marine Ecology Progress Series482: 241–253. https://doi.org/10.3354/meps10302.
Harms, J. H., Wallace, J. R., and Stewart, I. J. 2010. Analysis of fishery-independent hook and line-based data for use in the stock assessment of bocaccio rockfish (Sebastes paucispinis). Fisheries Research 106: 298–309. https://doi.org/10.1016/j.fishres.2010.08.010.
Harley, S. J., Myers, R. A., and Dunn, A. 2001. Is catch-per-unit-effort proportional to abundance? Can. J. Fish. Aquat. Sci. 58: 1760–1772. https://doi.org/10.1139/f01-112.
Harvey, E. S., Newman, S. J., McLean, D. L., Cappo, M., Meeuwig, J. J., and Skepper, C. L. 2012. Comparison of the relative efficiencies of stereo-BRUVs and traps for sampling tropical continental shelf demersal fishes. Fisheries Research 125:108–120. https://doi.org/10.1016/j.fishres.2012.01.026.
Gerstner, C. L. 1998. Use of substratum ripples for flow refuging by Atlantic cod, Gadus morhua. Environmental Biology of Fishes 51: 455-460. https://doi.org/10.1023/A:1007449630601.
Kulbicki, M. 1988. Correlation between catch data from bottom longlines and fish censures in the SW lagoon of New Caledonia. Proceedings of the 6th International Coral Reef Symposium 2: 305–312.
Kuriyama, P. T., Branch, T. A., Hicks, A. C., Harms, J. H., and Hamel, O. S. 2019. Investigating three sources of bias in hook-and-line surveys: survey design, gear saturation, and multispecies interactions. Can. J. Fish. Aquat. Sci. 76: 192–207. https://doi.org/10.1139/cjfas-2017-0286.
Millar, R. B., and Willis, T. J. 1999. Estimating the relative density of snapper in and around a marine reserve using a log-linear mixed-effects model. Australian & New Zealand Journal of Statistics 41: 383–394. https://doi.org/10.1111/1467-842X.00092.
Moser, J., and Shepherd, G. R. 2009. Seasonal distribution and movement of black sea bass (Centropristis striata) in the northwest Atlantic as determined from a mark-recapture experiment. J. Northw. Atl. Fish. Sci. 40: 17–28. https://doi.org/10.2960/J.v40.m638.
Musick, J. A., and Mercer, L. P. 1977. Seasonal distribution of black sea bass, Centropristis striata, in the Mid-Atlantic Bight with comments on the ecology and fisheries of the species. Fishery Bulletin 40: 479–488. https://doi:10.1577/1548-8659(1977)106<12:SDOBSB>2.0.CO;2.
NEFSC (Northeast Fisheries Science Center). 2017. 62nd northeast regional stock assessment workshop (62nd SAW) assessment report. NEFSC Ref. Doc. 17-03, 822 p. https://www.nefsc.noaa.gov/publications/crd/.
Newman, S. P., Rasmussen, P. W. and Andrews, L. M. 1997. Comparison of a stratified, instantaneous count creel survey with a complete mandatory creel census on Escanaba Lake, Wisconsin. North American Journal of Fisheries Management 17: 321–330. https://doi.org/10.1577/1548-8675(1997)017<0321:COASIC>2.3.CO;2.
Parker, D., Winker, H., Bernard, A. T. F., Heyns-Veale, E. R., Langlois, T. J., Harvey, E. S., and Götz, A. 2016. Insights from baited video sampling of temperate reef fishes: how biased are angling surveys? Fisheries Research 179: 191-201. https://doi.org/10.1016/j.fishres.2016.02.025.
Pennington, M., and T. Stromme. 1998. Surveys as a research tool for managing dynamic stocks. Fisheries Research 37: 97–106. https://doi.org/10.1016/S0165-7836(98)00129-5.
Pinheiro, J., Bates, D., DebRoy, S., Sarkar, D., and R Core Team. 2018. nlme: linear and nonlinear mixed effects models. R package vers. 3.1-137. http://CRAN.R-project.org/package=nlme.
Poisson, F., Gaertner, J-C., Taquet, M., Durbec, J-P., and Bigelow, K. 2010. Effects of lunar cycle and fishing operations on longline-caught pelagic fish: fishing performance, capture time, and survival of fish. Fishery Bulletin 108: 268–281.
R Core Team. 2018. R: a language and environment for statistical computing. R Foundation for Statistical Computing, Vienna, Austria. http://www.r-project.org.
Ralston, S. 1990. Size selection of snappers (Lutjanidae) by hook and line gear. Can. J. Fish. Aquat. Sci. 47: 696–700. https://doi.org/10.1139/f90-078.
Richards, L. J., and Schnute, J. T. 1986. An experimental and statistical approach to the question: is CPUE an index of abundance. Can. J. Fish. Aquat. Sci. 43: 1214–1227. https://doi.org/10.1139/f86-151.
RStudio Team. 2018. RStudio: Integrated development for R. RStudio, Inc., Boston, MA. http://www.rstudio.com/.
Rotherham, D., Underwood, A. J., Chapman, M. G., and Gray, C. A. 2007. A strategy for developing scientific sampling tools for fishery-independent surveys of estuarine fish in New South Wales, Australia. ICES Journal of Marine Science 64: 1512–1516. https://doi.org/10.1093/icesjms/fsm096.
Schweitzer, C. C., and Stevens, B. G. 2019. The relationship between fish abundance and benthic community structure on artificial reefs in the Mid-Atlantic Bight, and the importance of sea whip corals Leptogorgia virgulata. PeerJ 7: e7277. http://doi.org/10.7717/peerj.7277.
Schobernd, C. M., and Sedberry, G. R. 2009. Shelf-edge and upper-slope reef fish assemblages in the south Atlantic bight: habitat characteristics, spatial variation, and reproductive behavior. Bulletin of Marine Science 84: 67–92.
Schobernd, Z. H., Bacheler, N. M., and Conn, P. B. 2014. Examining the utility of alternative video monitoring metrics for indexing reef fish abundance. Can. J. Fish. Aquat. Sci. 71: 464–471. https://doi.org/10.1139/cjfas-2013-0086.
Shepherd, G. R., and Terceiro, M. 1994. The summer flounder, scup, and black sea bass fishery of the Middle Atlantic Bight and southern New England waters. NOAA Tech. Rep., NMFS 122, 13 p.
Sheremet, V. A. 2010. SeaHorse Tilt Current Meter: inexpensive near-bottom current measurements based on drag principle with coastal applications. Eos, Transactions, American Geophysical Union 91, Ocean Science Meeting Supplement, Abstract PO25C-13.
Sokal, R. R., and Rohlf, F. J. 1995. Biometry: The Principles and Practice of Statistics in Biological Research, 3rded., W.H. Freeman and Company, New York, 887 pp.
Steimle, F. W., and Zetlin, C. 2000. Reef habitats in the Middle Atlantic Bight: abundance, distribution, associated biological communities, and fishery resource use. Marine Fisheries Review 62: 24–42.
Stobart, B., Díaz, D., Álvarez, F., Alonso, C., Mallol, S., and Goñi, R. 2015. Performance of baited underwater video: does it underestimate abundance at high population densities? PLoS ONE 10: e0127559. https://doi.org/10.1371/journal.pone.0127559.
von Szalay, P. G., Somerton, D. A., and Kotwicki, S. 2007. Correlating trawl and acoustic data in the eastern Bering Sea: a first step toward improving biomass estimates of walleye pollock (Theragra chalcogramma) and Pacific cod (Gadus macrocephalus)? Fisheries Research 86: 77–83. https://doi.org/10.1016/j.fishres.2007.05.005.
Wells, R. J. D., Boswell, K. M., Cowan Jr., J. H. and Patterson III, W. F. 2008. Size selectivity of sampling gears targeting red snapper in the northern Gulf of Mexico. Fisheries Research. 89: 294–299. https://doi.org/10.1016/j.fishres.2007.10.010.
Willis, T. J., and Babcock., R. C., 2000. A baited underwater video system for the determination of relative density of carnivorous reef fish. Marine and Freshwater Research 51: 755–763. https://doi.org/10.1071/MF00010.
Willis, T. J., Millar, R. B., and Babcock, R. C. 2000. Detection of spatial variability in relative density of fishes: comparison of visual census, angling, and baited underwater video. Marine Ecology Progress Series 198: 249–260. https://doi.org/10.3354./meps198249.
2003. Protection of exploited fish in temperate regions: high density and biomass of snapper Pagrus auratus (Sparidae) in northern New Zealand marine reserves. Journal of Applied Ecology 40: 214–227. https://doi.org/10.1046/j.1365-2664.2003.00775.x.
Willis, T. J., Badalamenti, F., and Milazzo, M. 2006. Diel variability in counts of reef fishes and its implications for monitoring. Journal of Experimental Marine Biology and Ecology 331: 108–120. https://doi.org/10.1016/j.jembe.2005.10.003.
Zurr, A., Ieno, E. N., Walker, N., Saveliev, A. A., and Smith, G. M. 2009. Mixed effects models and extensions in ecology with R, Springer-Verlag, New York, 574 pp.
Cullen, D.W., and Stevens, B.G. 2020. A brief examination of underwater video and hook-and-line gears for sampling black sea bass (Centropristis striata) J. Northw. Atl. Fish. Sci., 51: 1–13. https://doi.org/10.2960/J.v51.m725