Introduction
Greenland halibut or Greenland turbot (Reinhardtius hippoglossoides) inhabits the polar regions of the North Atlantic and North Pacific oceans (Sohn et al., 2010). It is considered to be a deep water species because it is commonly harvested at the edge of the continental shelf at depths between 300 and 1000 m. In the northeast Atlantic, Greenland halibut is harvested using gillnets, longlines, demersal seines and trawls. The fishery is regulated by total allowable catches (TAC), vessel quotas, bycatch regulations and minimum landing and mesh sizes. In 2010, the Joint Norwegian-Russian Fisheries Commission agreed on an allocation key for Greenland halibut in which Norway has a share of 51%, Russia 45% and 4% was allocated to third countries. The landings of Greenland halibut from the Northeast Arctic reached 24 297 tonnes in 2016, whereof 57% is harvested with bottom trawls (ICES 2017, Bakketeig et al. 2017). Statistics from the Directorate of Fisheries (2016) show that the total Norwegian landings of Greenland halibut increased by 24% in weight from 12 717 metric tons in 2012 to 16 789 metric tons in 2016 with an increase of nearly 52% in landing prices, and the species is usually more valuable (€/kg) for fishermen than large cod (Gadus morhua).
In the trawl fishery, fishermen are only allowed to harvest Greenland halibut as an unavoidable species on a small bycatch quota in the trawl fishery directed for Arctic cod (Gadus morhua), haddock (Melanogrammus aeglefinus) and beaked redfish (Sebastes mentella). The latter species is caught along the continental shelf from N72o and further north and in depths where Greenland halibut frequently occurs.
In the Northern gadoid fisheries, rigid sorting grids have been mandatory in combination with minimum 130 mm (135 mm until 2011) mesh size in the codend since 1997. Fishermen are allowed to use three different grid systems and all have grids with a 55 mm bar spacing: a three-section system called Sort-X that is composed by two steel grids and a canvas section (Larsen and Isaksen, 1993), a double grid section composed by two grids made of plastic (i.e. bars made from fibre-glass) and rubber (Sistiaga et al., 2016), and a single steel grid section called Sort-V (Jørgensen et al., 2006; Herrmann et al., 2013b). Due to the high densities of cod encountered in the Barents Sea bottom trawl fishery new problems arise (Sistiaga et al., 2016; Brinkhof et al., 2017), especially related to blockage of accumulated fish in grid sections, with subsequent reduction in size selectivity and catch control. In an attempt to solve this issue the Norwegian authorities, research institutes and fishermen are testing alternative gear and grid designs that increase the sorting capacity of the grids (Gjøsund et al., 2013; Grimaldo et al., 2015).
Since Greenland halibut is an important bycatch species in the Barents Sea, the potential solutions applied to the trawl gear used to solve the diverse challenges existing in the cod and haddock fisheries today will have direct consequences for its selectivity. Selectivity studies for Greenland halibut can be found in the literature (Boje et al., 1997; Herrmann et al., 2013a; Huse et al., 1999; Lisovsky et al., 2004; Woll et al., 1998), but to the best of our knowledge Herrmann et al. (2013a) is the only documentation of the performance of sorting grids for Greenland halibut.
In the present investigation, we studied the performance of a new double steel grid system (Larsen et al., 2016), developed for the cod and haddock directed trawl fishery, to size select Greenland halibut. The new design was based on a Sort-V grid but is built in four panels rather than two. It has approx. 45% bigger cross section area and the lifting panel (Grimaldo et al., 2015) is substituted by a grid (lower grid) following the idea behind the Flexigrid system (See Herrmann et al. (2013b) and Sistiaga et al. (2016) for further information on the flexigrid design). The aim was to investigate the size selection in this new double steel grid section for Greenland halibut. Specifically our goal was to answer the following questions:
- Does this new grid design provide any change for Greenland halibut size selection compared to the existing grids?
- To what extent does Greenland halibut escape through the first grid (lower grid) of the section?
Materials and Methods
Vessel, time, area and fishing gear
We carried out a small-scale fishing trial on board the Research vessel RV Helmer Hanssen (63.8 m LOA and 4080 HP) 6-7 March, 2015. The tests were conducted in well-known fishing grounds off the coast of Finnmark and Troms counties, Norway (N71o30ˈ– E27o30ˈ and N70o30ˈ– E17o20ˈ), where Greenland halibut occurs in this period of the year.
We applied a trawl design commonly used in the Norwegian bottom trawl fisheries, i.e. an Alfredo No. 3 two-panel Euronete trawl with wings and belly entirely built in 155mm nominal mesh size (nms) polyethylene (PE) netting. The trawl had a headline of 36.5 m, a fishing line of 19.2 m and 454 meshes of circumference. The trawl system comprised a set of Injector bottom trawl doors (8.0m2 and 3.100 kg each), 60 m sweeps, and a 111 m ground gear. Each of the sides of the ground gear had ten 53 cm steel bobbins on a 46 m x 19 mm chain. Both sides of the ground gear were joined by a conventional 19.2 m long rock-hopper built with 53 cm rubber discs, which were attached to the fishing line of the trawl. The headline was equipped with 170 x 200 mm plastic floats. The trawl-system was monitored by various Scanmar-sensors. With the given rig-details we achieved a door spread of 128–133 m, a fishing line spread of ca. 14.5 m, and a headline height of 4.5–5.2 m at towing speeds of 3.5–4.0 knots in 250–320 m of depth.
We used the four-panel section with two steel grids inserted described by Larsen et al. (2016). This grid section was made from 138 mm nms Euroline Premium PE netting (single Ø 8.0 mm twine), was 26 meshes long (instead of 44.5 meshes like the mandatory Sort-V grid sections), and had 104 meshes in circumference (Fig. 1). All four selvedges in the grid section were made of 40 mm Danline PE rope. Exactly at the position where the lifting panel sits in the Sort-V section (Grimaldo et al., 2015), we installed a one-half standard steel grid (Sort-V type) with 55 mm bar spacing, hereafter called the lower grid (outer dimensions: length = 825 mm × width = 1234 mm). The upper grid was a standard steel grid (Sort-V type) with 55 mm bar spacing (outer dimensions: length = 1650 mm × width = 1234 mm) (Fig. 2). The lower grid was fixed to the side panels of the section to maintain an inclination angle of approximately 40º (Fig. 3). The back part of the square mesh lifting panel was made of 80 mm Euroline Premium PE netting (single Ø 3.0 mm twine). The square mesh guiding panel behind the upper grid was made of 80 mm (nominal mesh size = nms) Euroline Premium PE netting (single Ø 3.0mm twine). The guiding panel’s length was approximately one-half that used in the mandatory sorting grid section to avoid unnecessary extra netting that could influence the water flow, and it was attached with a steeper angle.

Fig. 1: Illustration showing the main dimensions and parts of the modified four-panel grid section. |
The section tested in this study differed from the original Sort-V section in two main ways. First, the lifting panel was replaced by the lower grid. Second, the grid section was built in four panels, which increased the space under the upper grid (Fig. 3).
 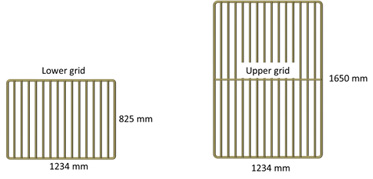 Fig. 2: Steel grids used in the modified grid section: a lifting grid (left) and a standard Sort-V grid (right). Fig. 2: Steel grids used in the modified grid section: a lifting grid (left) and a standard Sort-V grid (right). |
We used a transition diamond mesh section to connect the two-panel trawl belly to the four-panel grid section. It was made using 138 mm nms Euroline Premium PE netting (single Ø 8.0 mm twine), and it was 33.5 meshes long (Fig. 4).
We used two small-mesh grid covers (GCs) to collect separately fish escaping through respectively the lower and upper sorting grid. The upper grid was covered with a GC made of 52 mm (full mesh size) Euroline Premium PE netting (single Ø 2.4 mm twine) and had a total length of approximately 25 m (Larsen and Isaksen, 1993). The entire GC was reinforced with double 155 mm Euroline Premium PE netting (single Ø 4.0 mm twine) and 7 x 200 mm plastic floats were added along the mid-seam to ensure its inflation. The lower grid was covered with a GC made of 42 mm PA netting of Ø 1.0 mm in the front sections and 52 mm PE netting (single Ø 2.2 mm twine) in the aft sections, and had a total length of approximately 15 m. Total chain weights of ca. 15 kg were added along the mid-seam to ensure inflation of it. The installation of the GCs was done following standard procedures described by Larsen and Isaksen, (1993) and Wileman et al., (1996) (Fig. 4).

Fig. 3. Photographs of 1:2 scale models of the two-panel Sort-V grid section (left) and the four-panel double steel grid section (right) taken at SINTEF’s flume tank in Hirtshals (Denmark). Note the oversized lifting panel (striped white line) and the lack of space under the Sort-V grid in the two-panel section (white circle). |
The four-panel diamond-mesh codend used during the experiments was made from Euroline Premium PE netting (Polar Gold), with 138 mm (nominal mesh size) and 8 mm diameter single twine. It was 120 meshes long and had 80 meshes of circumference. All four selvedges were strengthened by 40 mm Danline PE rope. In total 7 round-straps (Ø 24 mm PE) were attached on the codend at intervals of 1.2 m. The codend (C) contained a small mesh liner (length = 14 m) constructed of 52 mm (nms) Euroline Premium PE netting (single Ø 2.2 mm twine) (Fig. 4).
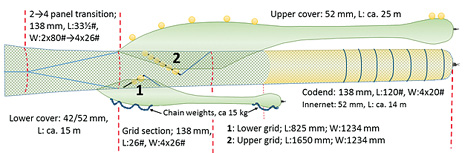
Fig. 4 Set-up during selectivity experiments with a double steel grid in front of a four-panel codend with small mesh liner. The small circles indicates 200 mm plastic floats attached to grids and the upper cover. The lower cover was inflated by ca. 15 kg chain weights along the cover. |
Greenland halibut from the codend and the GCs were measured to the nearest cm. Subsampling was only carried out for one haul due to the large number of Greenland halibut in the catch. All fish in the haul were counted to calculate the sampling fraction that was later included in the data analyses.
Two Scanmar flow recorders (i.e. a speed/symmetry and a grid sensor) were placed in the middle of a rectangular steel frame (1120 mm x 1000 mm) in the centre and ¾ down from the top, respectively. The flow measurements were made in front and the aft of the grid section with and without grid covers.
Modeling size selection in the double grid system
For a single 55 mm Sort-V grid system Herrmann et al. (2013b) successfully described the size selection of redfish using a CLogit size selection model (1), which accounted for that not necessary all fish entering the grid section made contact with the grid:
 (1) (1)
Only the fish contacting the grid obtain a size dependent probability for escaping through it. In the Clogit model, l denotes fish length and parameter C quantifies the assumed fish length independent probability for a fish entering the grid zone to also make contact with it in a way that provides it a length dependent probability for escaping through the grid. Thus, C undertakes a value between 0.0 and 1.0, where a value at 1.0 would mean that every fish entering the grid zone would make contact with the grid. A value at 0.3 on the other hand would mean that only 30% of the fish entering the grid zone would make contact with it. For the fish making contact with the grid the CLogit model assumes a traditional Logit size selection model (Wileman et al., 1996) defined by the parameters L50 (length at which the fish that makes selectivity contact with the grid has a 50% chance to escape through the grid) and SR (difference between the lengths at which a fish that makes selectivity contact with the grid has 75% and 25% chance of escaping through the grid) Sistiaga et al. (2016) extended this model to describe the size selection to describe the size of cod and haddock in flexigrid double grid system and Larsen et al. (2016) applied the same double grid size selection model for the size selection of redfish in the double grid system investigated in this study. Therefore, we apply the same model (2) in this study to describe the size selection of Greenland halibut in the double grid system:
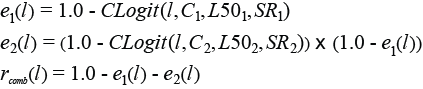 (2) (2)
For a Greenland halibut of length l that enters the double grid section e1(l) models the length dependent probability for it to escape through the first grid while e2(l) models the probability for it escaping through the second grid. If the Greenland halibut does not escape through one of the two grids it is still retained after passaging through the grid section for which the probability is described by rcomb(l). C1 quantifies the fraction of entering Greenland halibut that makes contact with the first grid and is subject to a size dependent probability for escapement through it. For those Greenland halibut, L501 and SR1 are the contact selectivity parameters assuming a Logit size selection model. For the Greenland halibut that reach the zone of the second grid, meaning that they have not previously escaped through the first grid, C2 quantifies the fraction of fish, which make contact with it and are subject to a size dependent probability for escapement through this grid. For those fish, L502 and SR2 are the contact selectivity parameters assuming a Logit size selection model. Thus, the size selectivity in the double grid system is according to equation (2) fully described by the six parameters C1, L501, SR1, C2, L502 and SR2. The selection properties of the individual grids, grid1 and grid2, is then described by respectively the parameters (C1, L501, SR1) and (C2, L502, SR2) following a CLogit size selection model (1). The probability for that a Greenland halibut entering the grid section makes contact with at least one of the two grids, Ccomb, can be expressed by:
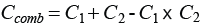 (3) (3)
The overall selectivity parameters for the whole grid section (first and second grid combined: L50comb and SRcomb), was estimated based on (2) using the numerical method described in Sistiaga et al. (2010).
Estimation of selection parameters for the double grid model
The values for the parameters for the overall selection model (C1, L501, SR1, C2, L502, and SR2) were obtained using Maximum Likelihood (ML) estimation based on the experimental data pooled over hauls j (1 to m) by minimizing:
 (4) (4)
where nGC1,l,j, nGC2,l,j, and nC,l,j denote the numbers of Greenland halibut length measured in haul j with length l that were collected in the GC for grid 1, the GC for grid 2, and the blinded and non-selective codend, respectively (Fig. 4). qGC1,j, qGC2,j, and qC,l,j denote the length-independent sampling factors length measured in haul j for the GC for the first grid, the GC for the second grid, and the blinded codend, respectively.
When estimating size selection in the double grid system by applying equations (2) and (4), the six selectivity parameters are not constrained in values, meaning that they are not value bound to each other. In addition to considering the initial scenario for modeling size selection of Greenland halibut in the double grid system, a number of constrained models were also tested. These constrained models were based on constraining pair-wise one or more parameters of the two grids to have the same value. Specifically, because the two grids have identical bar spacing, it is possible that size selection for the Greenland halibut that make contact with the grids would be similar or partly similar. Based on equation (2) with no parameter constraints, we created a family of constrained models in which one or more of the grid selection parameters (L50c, SRc) of the two grids were given the same value. Ultimately, we ended up considering four different models (Table 1).
Among the four different potential models described in Table 1, we chose the one with the lowest AIC value (Akaike, 1974). The goodness of fit diagnosis of the model selected to describe the experimental data was based on the p-value, model deviance vs. degrees of freedom, and inspection of the model curve’s ability to reflect the trends in the data. The ML estimation using equations (4) and (2) requires aggregation of the experimental data over hauls. This results in stronger data to estimate the average size selectivity, but it does not consider between-haul variation in selectivity (Fryer, 1991).
To account correctly for the effect of between-haul variation in the estimation of uncertainty in size selection and for the uncertainty in individual hauls due to sample sizes, we used a double bootstrap method (Millar, 1993). The procedure accounted for uncertainty due to between-haul variation in size selection by selecting m hauls with replacement from the m hauls available during each bootstrap repetition (equation 4). Within each resampled haul, the data for each length class were resampled in an inner bootstrap to account for the uncertainty in the size selection in the haul. The resulting data set obtained from each bootstrap repetition was analyzed using equation (2) and (4) as described above. Based on the bootstrap results we estimated the Efron percentile confidence intervals (CIs) (Efron, 1982; Chernick, 2007) for both the estimated parameters in equation (2) and the resulting curves for e1(l), e2(l), and rcomb(l). We used the software tool SELNET (Herrmann et al., 2012) for the analysis and applied 1000 bootstrap iterations to estimate CIs.
Using the CLogit model and inserting the values of the selection parameters for grid 1 (C1, L501, SR1) and grid 2 (C2, L502, SR2), we obtained size selection curves for the two grids for stand-alone deployments. By incorporating this estimation into the bootstrapping procedure, we also obtained 95% confidence limits for the grid’s stand-alone size selection curves. To determine whether the two selection curves had parts that were significantly different, we checked for overlap between the 95% confidence limits of the two curves. For the estimated selection parameters we used a similar approach to investigate whether the confidence limits overlapped.
Results
Observations of gear
Whether a gear set-up with multiple covers affects the efficiency and stability of the sorting device is always a question. The mean water flow measured in the center of the grid section when the covers were attached was 2.67 ± 0.04 knots. When the covers were removed, the flow at this point increased to 3.26 ± 0.12 knots, meaning that the covers reduced water flow by approximately 20%. Without the covers, the water flow values in front and behind the grids were 3.13 ± 0.12 and 2.89 ± 0.53 knots, respectively, representing a reduction of approximately 7.6%.
Selectivity analyses
We conducted six hauls with a sufficient number of Greenland halibut to be included in the analyses. Table 2 summarizes the catch data for Greenland halibut in those hauls. In all hauls except for haul 3 all Greenland halibut caught were length measured. In haul 3 the catch in the codend was subsampled and 36% of the Greenland Halibut were measured while the rest of the individuals were just counted to calculate the sampling ratio. In total 2446 Greenland halibut were caught and 1634 of them length measured.
The main other species caught in these hauls where haddock (n = 547), redfish (n = 347) and cod (n = 33). This reflect that during the six hauls addressing Greenland halibut size selection, this species was the main catch during those hauls. This is consistent with the bycatch level of Greenland halibut in cod and haddock directed fisheries (Huse et al., 1999).
The four models considered for describing the size selection in the double grid system were evaluated against each other based on their AIC values (Table 3).
The model assuming that both contact selectivity parameters, L50c and SRc, have identical values performed best (i.e., it had the lowest AIC value) (Table 3). This result was not unexpected, as the differences in selectivity between two grids with identical bar spacing likely would be defined solely by differences in contact probability. Considering the results shown in Table 3, the remaining analyses were carried out using model ID 4. Table 4 summarizes results of the analysis based on this model, and Figure 5 shows plots of the escapement through grid 1 and grid 2 and retention by the codend (with small mesh liner).
Table 1 shows that the selected constrained model ID4 can describe the size selection of Greenland halibut in the double grid system sufficiently well. The p-value of 0.99 (Table 4) indicates that the deviation between the fitted model and the experimental rates is likely a coincidence. This premise is further supported by the plots in Figure 5, as the modeled curves in all cases reflect the trends in the experimental data points well without any systematic patterns in the deviations. Thus, we are confident that it is valid to apply model ID4 to describe the size selection of Greenland halibut in the double grid system. From the estimated selection parameters (Table 4) several observations can be made:
- Only a very limited fraction of the Greenland halibut entering the grid section makes contact with grid 1 in a way that provides a size-dependent probability for escapement through this grid. It is estimated that only 11.30% (3.32% – 13.03%) of the fish do so.
- In contrast, 100% (31.35% – 100.00%) of the Greenland halibut reaching the zone of grid 2 actually make contact with it in such a way they have a size-dependent probability of escapement through it.
- The estimated L50c (L501 = L502) for the 55 mm bar spacing grid is 38.56 cm (34.68–53.22 cm ), which is low compared to the morphological limit of 77 cm obtained by Herrmann et al. (2013a). This indicates that some of the fish making contact with the grid are not optimally orientated for escapement, which is in line with the previous finding regarding grid size selection of Greenland halibut (Herrmann et al., 2013a).
Based on the CLogit model with the estimated parameter values in Table 1, Figure 6 plots the estimated size selection of grid 1, grid 2, and both grids combined. Size selection was much higher for grid 2 compared to grid 1, and this difference was due to the low contact probability obtained for the grid 1. Size selection of grid 2 was slightly better than the combined selectivity for both grids, but the difference was not statistically significant. Thus, the contribution of grid 1 to the overall selectivity was limited.
Figure 7 compares the combined Greenland halibut size selection in the double grid system to previous estimates for other grid systems with the same 55 mm bar spacing (Herrmann et al., 2013a). Compared to the Sort-X system, the differences in retention probabilities are only significant in the size range of 52 to 62 cm (first row). Compared to the Sort-V system this difference is significant in the size range of 36 to 77 cm (second row). For both sets of comparisons, size selection of the new double grid system was poorer than that obtained with the grid systems currently used in the fishery.
Discussion
The regulation mechanisms used in the Norwegian-Russian fishery management is fully described and the effects of them discussed in Gullestad et al. (2015). The background for the Norwegian regulation on Greenland halibut and the intention of the limited bycatch is to avoid closures in the general bottom trawl fishery for groundfish, i.e. species like cod, haddock, beaked redfish and partly saithe (Pollachius virens). Due to limited numbers of fish in each haul, it is relatively complicated to do a direct study on the size selectivity on Greenland halibut during the regulated small quota bycatch trawl fishery. We chose an area for the trials where we knew Greenland halibut would occur as an unavoidable bycatch species, but in limited numbers. We tested during experimental fishing the performance of a recently developed double steel grid system to estimate its ability to size select Greenland halibut in the Norwegian bottom trawl fishery targeting cod and haddock. The Greenland halibut bycatch selectivity data were analysed using a constrained version of a newly developed model (Larsen et al., 2016) that included direct quantification of the probability for fish to make selectivity contact with the individual grids. The first (lower) grid was very efficient at guiding all fish towards the upper grid (enhancing contact probability) without attenuating the water flow. However, nearly all of the escaping Greenland halibut escaped through the second (upper) grid. The release efficiency of the first (lower) grid was poor: approximately 11% of the Greenland halibut entering the grid section made contact with this grid in a way that gave it a size-dependent release probability. In contrast, we estimated that all the Greenland halibut still in grid section after the first grid made contact with the second (upper) grid. For most individuals, however, this contact was sub-optimal for size selection, as the estimated 50% retention length was far below what can be expected based on the morphology of Greenland halibut (Herrmann et al., 2013a). The sub-optimal contact with the second (upper) grid may result from the strong water flow. The 3.0–3.2 knot water flow through the grid section likely reduced the ability of fish to react to the approaching grid and orient themselves to pass through the bars of the grid and escape. If most fish arriving in the size selection zone in the grid section already are exhausted from swimming during the capture process (Winger et al., 2010), the relative flow (velocity) inside the grid section represents a key factor for effective size sorting (i.e., a higher relative water velocity gives fish less time to maneuver through selective devices). Escapement through the grids can only occur when Greenland halibut (and other species) orient along the grid bars. Fish that contact the grid sideways will in most cases slide along the full length of the grid bars and be unable to escape.
The poorer selectivity estimates for the new double steel grid section relative to those from the mandatory sorting grid sections currently in use (especially the two-panel Sort-V grid) may be the result of the two geometry modifications performed to increase water flow through the grid section (Fig. 3). The larger cross-sectional area of the new double steel grid section probably meant that the fish had less time to orient themselves properly towards the space between the grid bars compared to the two-panel Sort-V section. In the two-panel Sort-V section there is virtually no space between the lower part of the grid and the panel below, which means that fish have to force themselves under it to pass towards the codend and therefore stay in the grid zone for a longer period of time (Fig 3). Gjøsund et al. (2013) found that the relative water flow from the inlet to the outlet of a sorting grid section can be substantially reduced. As a response, scientists, management authorities, and fishermen have focused on developing grid sections with the aim of increasing water flow and fish passage without reducing their selective properties. The transition from a two-panel to a four-panel design improved water flow in a single grid system (Grimaldo et al., 2015). Our measurements showed strong water flow through the tested double grid system, which allows rapid transport of fish towards the codend. This rapid transport avoids the accumulation of fish and grid section clogging observed in other grid systems. However, it seems that the strong water flow through the new grid section negatively affects the size selectivity of Greenland halibut, i.e. shifts the L50 value towards smaller fish.
We measured a reduction in the water flow by adding the covers, but due to the few measurements it is not possible to draw a clear conclusion if they affected the size selection process of Greenland halibut compared to hauls without covers. During comparable experiments on size selection, the results were obtained with similar covers (see for example Larsen and Isaksen 1993; Sistiaga et al. 2010; Larsen et al. 2016). We compared our recent underwater recordings by older ones, and there is an indication of a stronger water flow through the tested (four-panel) grid section than through the earlier two-panel grid configurations as it is clear that fish pass faster through the grid section (personal observations). We therefore find the measured effects on size selectivity with the new grid design reliable.
Some precaution needs to be taken regarding the results obtained in the cruise as our fishing trial is based on only 6 hauls and the amount of Greenland halibut length measured is limited to 1634 (Table 2), which leads to uncertainty in the estimated size selection curves. This also needs to be considered when making conclusions based on the results obtained. However, these uncertainties are reflected in the confidence bands around the size selection curves and parameters that are provided along with the results. Therefore, as long as these confidence bands are considered when making conclusions, the limited number of fish caught and measured in this study should not be a major concern. The numbers of Greenland halibut length measured during the six hauls we used in this study were acceptable for the statistical analyses. Further, it was the main species caught during those hauls where size selectivity for the species was estimated. In the same hauls, we caught 547 haddock, 347 redfish and 33 cod. This demonstrates that during the six hauls, Greenland halibut was the main catch. This also reflects how the limited catches of Greenland halibut caught in the cod and haddock directed fishery often are harvested with a few hauls conducted in fishing areas where Greenland halibut is an abundant species. Therefore, we choose to apply a similar practice to obtain size selective estimates that best reflect how Greenland halibut typically would be harvested in a commercial fishery. Given the limited quota only six hauls were possible to conduct, which is a low number compared to most trawl selectivity studies, but it is a similar amount of hauls as conducted for the only two other selectivity cruises (with respectively four and six hauls), assessing fishing grid size selectivity of Greenland Halibut (Herrmann et al., 2013a). Considering this, the current study contributes with valuable information on size selectivity of Greenland halibut in trawls using sorting grids as long as inference made do not compromise the wideness of the confidence bands for the obtained size selection curve resulting from that this is a small-scale study. The data we achieved during the trials reflect the scenario fish trawlers meet in the area we conducted our trials and from a management point of view we believe it is important to know the size selectivity of Greenland halibut under such conditions.
Acknowledgements
We thank the crew of the RV Helmer Hanssen, Iñigo Onandia and MSc student Ixai Salvo for their valuable assistance onboard the vessel. We appreciate the efforts of the editor and two anonymous reviewers, which we feel improved our manuscript significantly. We are also grateful for technical support from the Directorate of Fisheries, funding from the Research Council of Norway (specifically through the RCN project 243627: “Managing trawl catches by improving the hydrodynamic performance of sorting grid sections and codends”) and the Arctic University of Norway UIT.
References
AKAIKE, H. 1974. A new look at the statistical model identification. IEEE Trans. Autom. Control 19: 716–723. DOI.org/10.1109/TAC.1974.1100705
BOJE, J., A. GUNDERSEN, and A. WOLL. 1997. Gillnet selectivity in the fishery for Greenland halibut in East Greenland. ICES CM 1997/FF:04: 5 p.
BAKKETEIG I. E., M. HAUGE, and C. OG KVAMME (red). 2017. Havforskningsrapporten 2017. Fisken og havet, særnr. 1–2017.
BRINKHOF, J., B. HERRMANN, R. B. LARSEN, and M. SISTIAGA. 2017. Escape rate for cod (Gadus morhua) from the codend during buffer towing. ICES Journal of Marine Science, DOI.org/10.1093/icesjms/fsx200.
CHERNICK, M. R. 2007. Bootstrap methods: A guide for practitioners and researchers, second edition. Wiley series in probability and statistics. Wiley, New York. DOI.org/10.1002/9780470192573
DIRECTORATE OF FISHERIES. 2016. Økonomiske og biologiske nøkkeltal frå dei norske fiskeria - 2016 / Economic and biological figures from Norwegian fisheries – 2016. ISSN: 2464-3157.
EFRON, B. 1982. The jackknife, the bootstrap and other resampling plans. SIAM Monograph No 38, CBSM-NSF. DOI.org/10.1137/1.9781611970319
FRYER, R. J. 1991. A model of between-haul variation in selectivity. ICES J. Mar. Sci. 48: 281–290. DOI.org/10.1093/icesjms/48.3.281
GJØSUND, S. H., E. GRIMALDO, M. SISTIAGA, and K. HANSEN. 2013. Hastighetsmålinger i 2- og 4-panel enkeltrist-seksjoner [Velocity measurements in 2- and 4-panel single grid sections]. SINTEF Fisheries and Aquaculture REPORT A24698. Trondheim (August 2013). ISBN 978-82-14-05641-9. (in Norwegian)
GRIMALDO, E., M. SISTIAGA, B. HERRMANN, S. H. GJØSUND, and T. JØRGENSEN. 2015. Effect of the lifting panel on selectivity of a compulsory grid section (Sort-V) used by the demersal trawler fleet in the Barents Sea cod fishery. Fish. Res. 170: 158–165. DOI.org/10.1016/j.fishres.2015.05.028
GULLESTAD, P., G. BLOM, G. BAKKE, and B. BOGSTAD. 2015. The “Discard Ban Package”: Experiences in efforts to improve the exploitation patterns in Norwegian fisheries. Marine Policy 54: (2015) 1–9. DOI.org/10.1016/j.marpol.2014.09.025
HE, P., and V. BALZANO. 2012. Improving size selectivity of shrimp trawls in the Gulf of Maine with a modified dual-grid size-sorting system. N. Am. J. Fish. Manage. 32: 1113–1122. DOI.org/10.1080/02755947.2012.720642
HERRMANN, B., M. SISTIAGA, K. N. NIELSEN, and R. B. LARSEN. 2012. Understanding the size selectivity of redfish (Sebastes spp.) in North Atlantic trawl codends. J. Nor. Atlan. Fish. Sci. 44: 1–13. DOI.org/10.2960/J.v44.m680
HERRMANN, B., M. SISTIAGA, R. B. LARSEN, K. N. NIELSEN, and E. GRIMALDO. 2013a. Understanding sorting grid and codend size selectivity of Greenland halibut (Reinhardtius hippoglossoides). Fish. Res. 146: 59–73.
HERRMANN, B., M. SISTIAGA, R. B. LARSEN, and K. N. NIELSEN. 2013b. Size selectivity of redfish (Sebastes spp.) in the Northeast Atlantic using grid-based selection systems for trawls. Aquat. Living Resour. 26: 109–120. DOI.org/10.1051/alr/2013051
HUSE, I., A. GUNDERSEN, and K. H. NEDREAAS. 1999. Relative selectivity of Greenland halibut (Reinhardtius hippoglossoides, Walbaum) by trawls, longlines and gillnets. Fish. Res. 44: 75–93. DOI.org/10.1016/S0165-7836(99)00041-7
ICES 2017. ICES Advice on fishing opportunities, catch, and effort Arctic Ocean, Barents Sea, Faroes, Greenland Sea, Iceland Sea and Norwegian Sea Ecoregions ghl.27.1-2. DOI.org/10.17895/ices.pub.3048.
JØRGENSEN, T., O. INGÓLFSSON, N. GRAHAM, and B. ISAKSEN. 2006. Size selection of cod by rigid grids—Is anything gained compared to diamond mesh codends only? Fish. Res. 79: 337–348. DOI.org/10.1016/j.fishres.2006.01.017
LARSEN, R. B., and B. ISAKSEN. 1993. Size selectivity of rigid sorting grids in bottom trawls for Atlantic cod (Gadus morhua) and haddock (Melangorammus aeglefinus). ICES Mar. Sci. Symp. 196: 178–182.
LARSEN, R. B., B. HERRMANN, M. SISTIAGA, E. GRIMALDO, I. TATONE, and I. ONANDIA. 2016. Size selection of redfish (Sebastes spp.) in a double grid system: Quantifying escapement through individual grids and comparison to former grid trials. Fisheries Research 183: 385–395. DOI.org/10.1016/j.fishres.2016.07.013
LISOVSKY, S., Y. A. KONDRATYUK, and A. A. PAVLENKO. 2004. Selectivity of cod-ends with standard 150, 160 and 170 mm mesh size in Greenland halibut trawl fishery in Division 3L of the NAFO Regulatory Area and possible results of mesh size increase in more than 130 mm. NAFO SCR documents 04/6: 18 p.
LOMELI, M. J. M., and W. W. WAKEFIELD. 2013. A flexible sorting grid to reduce Pacific halibut (Hippoglossus stenolepis) bycatch in the U.S. west coast groundfish bottom trawl fishery. Fish. Res. 143: 102–108. DOI.org/10.1016/j.fishres.2013.01.017
MILLAR, R. B. 1993. Incorporation of between-haul variation using bootstrapping and nonparametric estimation of selection curves. Fish. Bull. 91: 564–572.
SARDÁ, F., B. MOLÍ, and I. PALOMERA. 2004. Preservation of juvenile hake (Merluccius merluccius, L.) in the western Mediterranean demersal trawl fishery by using sorting grids. Scientia Marina 68: 435–444. DOI.org/10.3989/scimar.2004.68n3435
SISTIAGA, M., E. GRIMALDO, and R. B. LARSEN. 2008. Size selectivity patterns in the North-east Arctic cod and haddock fishery with sorting grids of 55, 60, 70 and 80 mm. Fish. Res 93: (1–2), 195–203. DOI.org/10.1016/j.fishres.2008.04.014
SISTIAGA, M., B. HERRMANN, E. GRIMALDO, and R. B. LARSEN. 2010. Assessment of dual selection in grid based selectivity systems. Fish. Res. 105, 187–199. DOI.org/10.1016/j.fishres.2010.05.006
SISTIAGA, M., J. BRINKHOF, B. HERRMANN, E. GRIMALDO, L. LANGÅRD, and D. LILLENG. 2016. Size selection performance of two flexible sorting grid section designs in the Northeast Arctic cod (Gadus morhua) and haddock (Melanogrammus aeglefinnus) fishery. Fisheries Research 183: 340–351. DOI.org/10.1016/j.fishres.2016.06.022
SOHN, D., L. CIANNELLI, and J. T. DUFFY-ANDERSON. 2010. Distribution and drift pathways of Greenland halibut (Reinhardtius hippoglossoides) during early life stages in the eastern Bering Sea and Aleutian Islands. Fish. Oceanogr. 19:5 339–353. DOI.org/10.1111/j.1365-2419.2010.00549.x
WILEMAN, D. A., R. S. T. FERRO, R. FONTEYNE, and R. B. MILLAR, (Eds.). 1996. Manual of methods of measuring the selectivity of towed fishing gears. ICES Cooperative Research Report No. 215.
WOLL, A. K., J. BOJE, R. HOLST, and A. C. GUNDERSEN. 1998. Catch rates and hook and bait selectivity in longline fishery for Greenland halibut at East Greenland. ICES CM 1998/O:28: 13 p.
|