Introduction
In the early 1970s, the International Commission for Northwest Atlantic Fisheries (ICNAF), the predecessor of the Northwest Atlantic Fisheries Organization (NAFO), adopted regulations that set limits on the catch that could be taken from each of the groundfish populations (stocks) that were of commercial importance. The Total Allowable Catch (TAC) from a particular fish stock was based on an estimate of its absolute size calculated using what were then new scientific methods, now referred to as Sequential Population Analyses (SPA).
Time series of relative abundance indicators were required for the “calibration” of SPA estimates of stock abundance. Initially, fishing success (catch rate) of the commercial fleets was used to determine abundance, but it was recognized that commercial catch rates were influenced by a variety of factors other than abundance (Kulka et al., 1996) and that the fishery-independent abundance estimates provided by standardized research vessel (RV) surveys were preferable. Consequently, series of bottom trawl surveys, based on a stratified-random (SR) sampling design, were initiated for all Northwest Atlantic fishing areas (Doubleday, 1981; Doubleday and Rivard, 1981). In NAFO Subarea 3, SR surveys were initiated by the Fisheries Research Board of Canada, Biological Station, St. John’s, Newfoundland, (now Science Branch, Department of Fisheries and Oceans (DFO) Newfoundland Region), in Division 3N in 1971, Subdivision 3Ps in 1972 and in Division 3O in 1973. Research vessel surveys based on a fixed station transect sampling design had been conducted previously in these areas for about 20 years (Pitt et al., 1981). However, the data from these were not directly comparable to those from the new SR survey series, and thus were not utilized in SPA calibrations.
These transect data are the earliest available for the stocks in question and therefore provide an invaluable means of examining early stock dynamics. They have been used previously, along with SR survey data, in a study of long-term fish community changes in 3Ps and 3NO by Casey (MS 2000), and her results were utilized by Myers and Worm (2003) in a study describing depletion of predatory fish communities worldwide. The conclusions of these authors were based on abundance estimates within a set of index strata extending to a depth of 275 m (150 ftms) in 3NO and of 365 m (200 ftms) in 3Ps. However, fishing was conducted at depths greater than these in all years, and it has been demonstrated that temporal changes in depth preferences of species do occur as a response to changes in abundance and/or temperature (e.g. Fréchet and Gagnon (1993), Kulka et al. (1995), Kulka et al. (1996) and Atkinson et al. (1997) for cod). Thus, there is a possibility that the results of Casey, and Myers and Worm, were confounded by temporal changes in species depth distribution. The present analyses investigate this possibility.
The primary commercial species, Atlantic cod (Gadus morhua), haddock (Melanogrammus aeglefinus), American plaice (Hippoglossoides platessoides) and yellowtail flounder (Limanda ferruginea), were utilized to obtain what the present authors considered to be the best estimates of population parameters for comparison with the estimates reported by Casey. These species comprised about 70% of the biomass of all the species considered by Casey in 3NO and about 35% of the biomass of those in 3Ps. Comparisons are made also with the results of SPAs conducted for the cod populations in these study areas as these extended back to the transect survey years. For these, the consistency of estimates of size/age structure and mortality from transect surveys with those calculated from these SPAs was evaluated, giving further indicators for evaluation of the consistency of transect survey population estimates with those from the subsequent SR surveys. The sensitivity of results to the decision-making criteria used by Casey and by the present authors for integration of the data series is examined. Also, the conclusions of Myers and Worm regarding progressive declines in Gadoid and Pleuronectid populations in Divisions 3NO and Subdivision 3Ps from the beginning of the 1950s are reviewed in light of present findings.
Methods
The data used in the present analyses were provided to the authors by DFO, Newfoundland and Labrador Region, as were those utilized previously by Casey. For 3NO surveys, these data extended from 1950 and, for 3Ps, from 1953. Although earlier surveys were conducted, the results of these were recognized as being biased (e.g., Templeman et al., 1978), or were no longer available. Since the stock area for American plaice and yellowtail flounder are 3LNO and the standard historical RV surveys were for 3NO only, the assumption is made that the proportion of the stock inhabiting 3L remained relatively constant over the period.
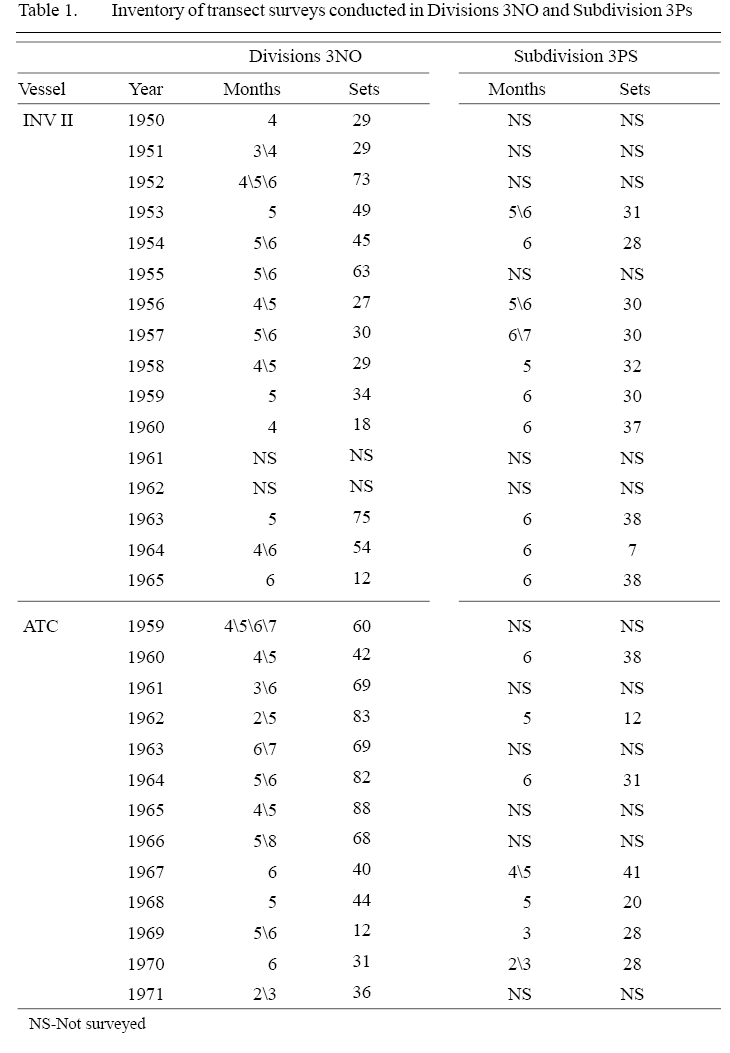 Table 1 Table 1 |
Transects extended from shallow to deep water (38–369 m) and fishing was conducted on each transect at standard depth intervals. An inventory of the data used from these surveys is in Table 1. In the SR period, fishing was conducted in waters much deeper than in the transect period (Table 2). When calculating biomasses, Casey adjusted for catchability of the research gear using factors proposed by Edwards (1968) but these factors are used in the present analyses only to derive estimates of the gadoid and pleuronectid biomasses that are directly comparable with those in Fig. 3 in Myers and Worm (2003). The geographic locations of transects, and of the strata used on subsequent SR surveys, are illustrated in Pitt et al. (1981).
On the survey vessel used initially, the Investigator II (INV II), fishing was conducted during daylight hours only. Thus, abundance data from surveys conducted subsequently by the A.T. Cameron (ATC) and the Wilfred Templeman (WT), on which sampling occurred on a 24-hr. basis, were standardized to INV II units by adjusting catches in night sets for diel variation in catchability, using conversion factors provided by Casey (2000). Catches by the ATC and WT were adjusted also for the greater area swept by the gears used compared to that used by INV II, again following Casey, rather than utilizing the results from the only comparative fishing experiment conducted during the period between these vessels (Gavaris and Brodie, 1984) as the reliability of such experiments is low (Halliday and Pinhorn, 2009). Distance towed was typically 3.3 km. Catches from the few sets that varied from that were prorated to this distance.
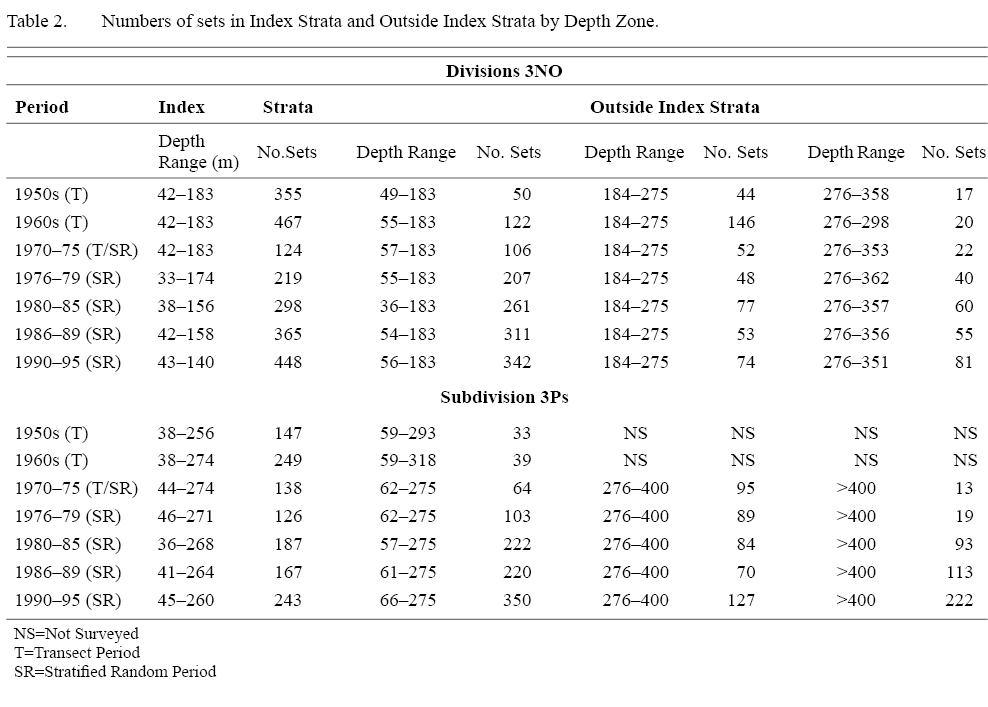 Table 2 Table 2 |
Transect survey data were standardized with those from SR surveys by assigning the sets in fixed transect stations to the strata used in the subsequent SR surveys. Assignments were made on the basis of the position and depth of transect stations in relation to stratum boundaries, preference being given to depth as this was the more accurately measured parameter. Annual biomass estimates were then derived for each stratum by the swept area method (Doubleday, 1981) and summed to derive overall annual biomass estimates. This is the same procedure as that used by Casey (2000). The small numbers of cases where there was only one set per stratum were eliminated from the analyses. The number of sets per stratum ranged from 2 to 14 with a mean of 4.2 for 3NO and from 2 to 11 with a mean of 4.1 for 3Ps.
The area surveyed varied over time in both survey series but standardized time series of abundance estimates were obtained for each species in each of the study areas based on those area/depth strata that were most regularly fished. For 3NO populations, abundance estimates were obtained for a subset of 11 ‘index’ strata, all shallower than 183 m (100 ftm) that were surveyed in at least 15 years during 1950–70, the transect sampling period. In Casey’s analyses the strata utilized extended to 275 m (150 ftm). For 3Ps, the analysis was based on a subset of eight index strata, all shallower than 275 m that encompassed St. Pierre Bank in the eastern part of the Subdivision. These eight strata were surveyed in at least 12 years during the transect sampling period, 1953–70. In this case, the strata utilized in Casey’s analyses extended to 365 m (200 ftm). Substantial numbers of sets were made in areas outside the index strata also, primarily in the stratified random period (Table 2), and biomass indices from all strata fished during this period are shown for comparison. The study period extended to 1995 to match that of Casey. This end date post-dates the collapse of the groundfish stocks in the area.
On almost all surveys, data collected were adequate to describe abundance, length composition and age composition of the study species. Visual examination did not indicate that there were discontinuities in RV parameter estimates at the time of transition between sampling methods.
Comparisons of estimates of population parameters from transect surveys with those from SPAs were restricted to the cod stocks since no SPAs were conducted for haddock and, for plaice and yellowtail, the statistical areas used for stock assessment and the areas for which adequate survey data were available to the authors did not coincide. The SPAs used in comparisons were, in 3NO, that of Power et al. (2010) and, in 3Ps, that of Brattey et al. (2002). The results utilized were for the years 1959–1979 for 3NO, and 1959–1978 for 3Ps, thereby excluding those, more recent, years influenced by SPA calibration (Pope, 1972). The parameters compared were population size (ages 2+), recruitment (numbers at age 4 for 3NO, age 5 for 3Ps) and total mortality (Z). (The estimates of Z from survey data were obtained by fitting least square straight lines to log numbers per set for each year-class for ages 4–12 for 3NO cod and ages 5–12 for 3Ps cod.) Temperatures recorded were the bottom temperatures at the end of each research vessel tow.
The time-period used for summarizing the data in Table 2 and in Fig. 6 varied from 4 to 6 years to correspond to phases observed in the data as follows: 1970–75 - a period of low biomass, 1976–79 and 1980–85 - to cover the rebuilding phase, 1986–89 - to cover the beginning of the collapse, and 1990–95 - to cover the period of the collapse.
Results
Survey Estimates of Population Biomass
Survey estimates of biomass in the index strata for the four study species in each of the study areas, 3NO and eastern 3Ps correlated well with the estimates of Casey, R2 ranging from 0.77 to 1.00. Biomass estimates for all strata fished, in the years after the introduction of stratified-random sampling in 1972–73, are compared with those for the index strata to confirm that the index strata provide satisfactory indicators of the populations overall.
3NO (Fig. 1)
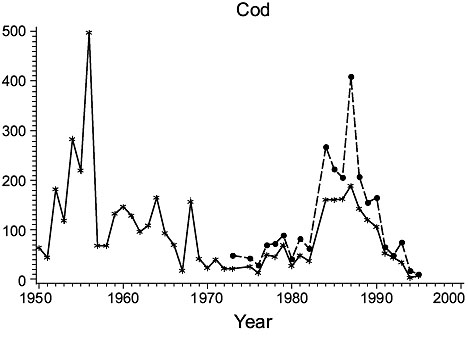


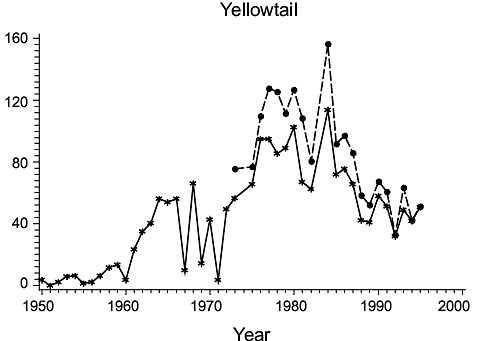 Fig. 1. Biomass (000 MT) for the major species in Divisions 3NO. (Solid line - indices from Index Strata; Dashed line - indices from All Strata (after 1972). Fig. 1. Biomass (000 MT) for the major species in Divisions 3NO. (Solid line - indices from Index Strata; Dashed line - indices from All Strata (after 1972). |
Cod: Biomass increased from a low level in 1950–51 to a peak in the mid-1950s, but declined precipitously thereafter to an intermediate level maintained through most of the 1960s before declining again to a level comparable to that in 1950–51. Biomass remained low throughout the 1970s and into the 1980s, but then returned to about 1960s levels in the mid to late 1980s, before again declining to the lowest level in the time series by the mid-1990s. Estimates from all strata were not greatly higher than those for the index strata and varied similarly.
Haddock: Biomass was low in 1950, but increased greatly immediately thereafter. It fluctuated at high levels in the 1953–60 period, then returned to, and remained at, very low levels. Indices from all strata and index strata were almost identical.
American plaice: Biomass was low in the 1950s but increased to a peak in the mid-1960s and generally remained at this level to the mid-1980s, before declining. In this case, estimates for all strata were approximately double those for index strata, indicating that a substantial portion of the population occurred outside the index strata. Nonetheless, both indices show a decline in biomass in the late1980s and early 1990s.
Yellowtail flounder: Biomass was very low in the 1950s, but increased greatly in the 1960s and reached its highest level in the late 1970s to early 1980s, declining thereafter (R2 = 0.74 with Casey). The lower correlation with the results of Casey reflects a dichotomy in estimates after 1972, which can be satisfactorily explained if one assumes that Casey neglected to apply the catchability factor of 0.39 to 1973–95 data. Making such an adjustment to Casey’s data improves the correlation with present estimates to R2=0.86. Estimates of biomass from all strata in the post-1972/73 period were almost the same as those for index strata, reflecting the shallow water distribution of this species (less than ~90 m).
3Ps (Fig. 2)
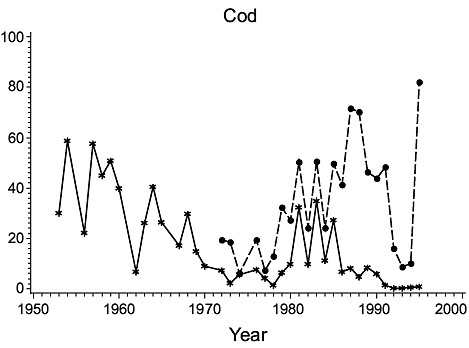
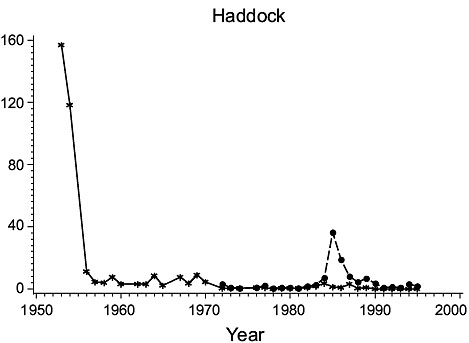
Fig. 2. Biomass (000 MT) for the major species in Subdivision 3Ps (Solid line - indices from the Index Strata; Dashed line - indices from All Strata (after 1972). |
Cod: Biomass was high in the 1950s, but subsequently declined steadily to a minimum in the mid-1970s. It rebuilt to some extent in the early 1980s but declined greatly thereafter to very low levels, consistent with the results of Casey. Estimates for all strata varied similarly to those for the index strata until 1985, but then diverged substantially, indicating a change in the proportion of the biomass occurring outside the index strata.
Haddock: Biomass was high in 1953 and 1954 but by 1956 had declined to a very low level at which it remained. However, estimates for all strata detected a peak in abundance in years 1984–90 not observed in the index strata.
American plaice: Biomass estimates from index strata were highly variable, low values occurring in the 1950s, about 1970 and in the late 1970s and early 1990s. Estimates for all strata were substantially higher (about 160%) than those from the index strata but varied similarly.
Yellowtail flounder: Biomass was quite variable throughout the period with highs in the mid-1960s and mid-1980s and lows in the mid-1970s. The estimates from the index strata and all strata were almost identical because yellowtail are seldom found deeper than 90 m.
Survey versus SPA estimates of population parameters
3NO cod (Fig. 3)
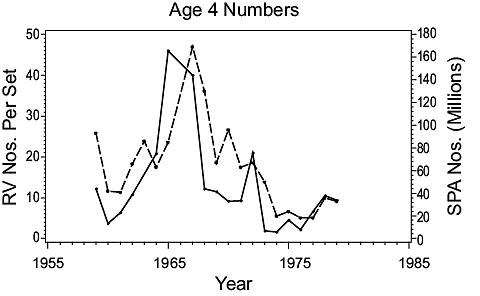

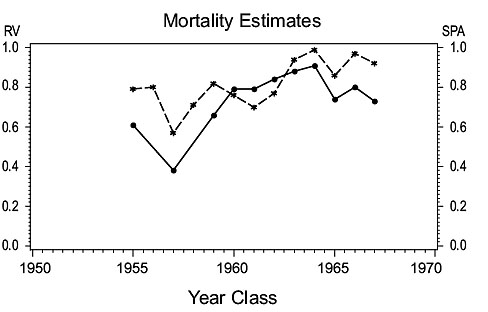 Fig. 3. Comparisons of estimates of population parameters from research vessel surveys and from SPA for Divisions 3NO cod. (Solid line - research vessel estimates; dashed line - SPA estimates). Fig. 3. Comparisons of estimates of population parameters from research vessel surveys and from SPA for Divisions 3NO cod. (Solid line - research vessel estimates; dashed line - SPA estimates). |
Abundance: Both RV and SPA indices of age 2+ numbers show that abundance increased from low levels in the 1950s to a peak in the mid-1960s, then declined to a low level in the early 1970s.
Recruitment: SPA age 4 numbers and the RV age 4 numbers-per-set both show abundance of 4 year olds was low in the late 1950s increasing to a peak in the mid-1960s and then declining to a very low level in the early 1970s.
Mortality: Total mortality estimates (Z) for the year classes 1955–67 in the RV and SPA series are in broad agreement, both showing Z to be low for the late 1950s year classes, increasing to higher levels for the mid to late 1960s year classes.
3Ps cod (Fig. 4)
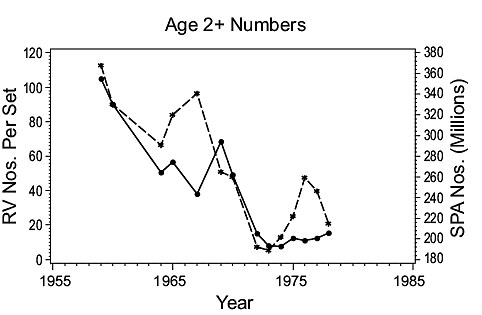

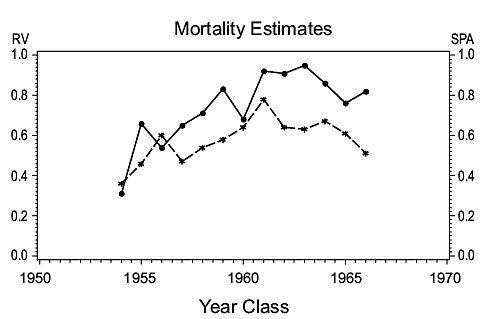 Fig. 4. Comparisons of estimates of population parameters derived from research vessel surveys and from SPA for Subdivisions 3Ps cod. (Solid line - research vessel estimates; dashed line - SPA estimates) Fig. 4. Comparisons of estimates of population parameters derived from research vessel surveys and from SPA for Subdivisions 3Ps cod. (Solid line - research vessel estimates; dashed line - SPA estimates) |
Abundance: Both RV and SPA indices of age 2+ numbers show that a high level of abundance in the early 1960s was followed by a decline to a very low level in the mid-1970s where it remained in subsequent years.
Recruitment: At age 5, the first age fully recruited to the fishery, survey data show sharp peaks in recruitment in 1960, 1968 and 1979 while the SPA data show peaks in 1960, late 1960s and late 1970s. Thus, estimates from the two sources were in general agreement.
Mortality: The Z-values calculated by year class from RV and SPA data were in close agreement, Z increasing steadily from the 1954 year-class to the early to mid-1960s year-classes.
Discussion
The present analyses evaluate biomass estimates derived by Casey (MS 2000) for cod, haddock, American plaice and yellowtail flounder using RV survey data from southern Grand Bank in 3NO and St. Pierre Bank in 3Ps in the period 1950–1995.
The biomass trends obtained proved to be in close agreement with those of Casey when the comparisons were restricted to a selected set of strata that were sampled consistently from the beginning of the 1950s to 1995. Inclusion of samples from a larger area, surveyed by the stratified random surveys conducted from the early 1970s, made little difference to the estimates obtained for the shallow-water species, haddock and yellowtail, but estimates for the more deeply-distributed cod and plaice were higher when all strata were included in the calculations. However, the pattern of inter-annual variation in abundance was similar between index-strata and all-strata estimates, except for cod, haddock and plaice on St. Pierre Bank from about 1985 onwards. This correspondence for most of the stocks verified the assumption that the biomass estimates from the Index Strata were representative of the area as a whole. The disparity for St. Pierre Bank, where all-strata estimates for these three species were much higher than those for index strata only, was brought about by their avoidance of an influx of very cold water in the 1986–89 and 1990–95 periods in the depths corresponding to the Index Strata (Fig. 6) by moving deeper, fish being found in abundance as deep as 550–730 m. This movement to deeper water outside the Index Strata was missed by Casey and, consequently, by Myers and Worm (2003), because their conclusions were based on Index Strata only. Thus, their conclusion that the cod biomass in 3Ps declined continuously from the 1950’s was erroneous.
For cod, the population parameters of biomass, population numbers, recruitment and mortality estimated from SPA calculations in both 3NO and 3Ps were in good agreement with those from the transect surveys conducted in the 1960s and early 1970s, although in the case of St. Pierre Bank cod, the peaks in recruitment in 1968 and 1979 were less pronounced than in the survey data. For both populations, the comparisons indicate that the SPAs provided valid measures of changes in population during this period, despite the uncertainties in catch statistics and the deficiencies in biological sampling of catches at that time (Halliday and Pinhorn, 1996).
The results of Casey were used by Myers and Worm (2003) to describe trends in overall biomass of gadoid, and of pleuronectid, species in Div. 3NO and 3Ps. Estimates of biomass for these two families based on present results are in close agreement with those of Myers and Worm (Fig. 5) (R2=0.90 for Gadoid species and 0.85 for Pleuronectid species). This is to be expected, as the comparison is dominated by the present study species, and the close similarity of estimates reported here for these species with those of Casey has already been noted.
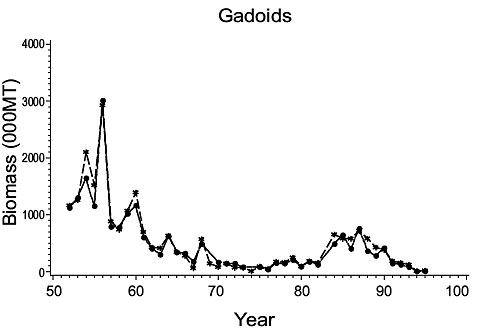
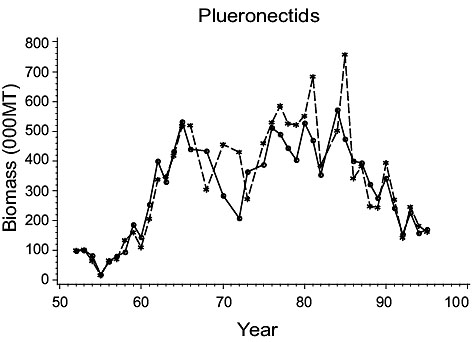 Fig. 5. Gadoid and Plueronectid biomass for Divisions 3NO. (Dashed line - indices from Myers and Worm; solid line - biomass indices from present paper). Fig. 5. Gadoid and Plueronectid biomass for Divisions 3NO. (Dashed line - indices from Myers and Worm; solid line - biomass indices from present paper). |
However, the difference between the present and previous studies lies in their interpretation of the data. Myers and Worm’s interpretation of Gadoids in Fig. 5, after applying a local regression smoother, is a net decline in the biomass over the entire period in accordance with their hypothesis. However, considering the original data for gadoids, which is basically cod after the early 1960s, the biomass declined from a high in the mid-1950s to lows of less than 100,000 MT in the 1970s, in conjunction with several other species, but had rebuilt to over 700,000 mt by the late -1980s after which it declined precipitously. The pleuronectid biomass increased from very low levels in the early-mid 1950s to a peak of 550,000 mt by 1965. It then declined to a low of 300,000 mt by 1972, as noted above for the Gadoids, but had rebuilt to about 500,000 mt by the late 1970s to mid-1980s then declined precipitously.
Another important difference between the present analysis and that of Myers and Worm is the role of the data points for 1950 and 1951 in 3NO in the present study, which shows gadoid biomass to be much lower than in the immediately following years. This leads to a different interpretation of the status of these populations in the 1950s than that presented by Myers and Worm, one that shows large increases in abundance of cod and haddock from very low levels at the beginning of the 1950’s to very high levels by mid-decade. The increase in haddock abundance was due to recruitment of a very large 1949 year-class and subsequently by a large 1955 year-class (Templeman, 1966). For cod, data are scant, but Williamson (MS 1965) identified 1949, 1955 and 1958 year classes as being particularly strong in both 3NO and 3Ps. This suggests that the peak abundance of cod in the mid-1950s was supported substantially by the 1949 cohort and abundance in the late 1950s and the 1960s by those of 1955 and 1958. The first year of present data for 3Ps was 1953, and thus they do not show whether or not there was an increase in the initial years of the 1950s, but Williamson’s data for cod indicate a similar pattern of year-class strengths in this area as in 3NO.
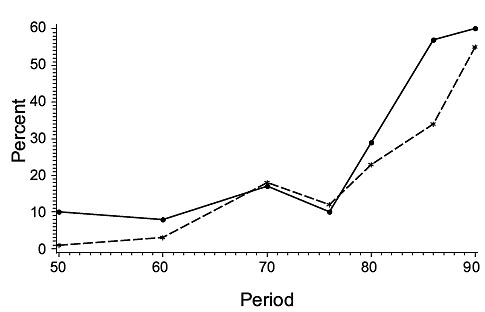
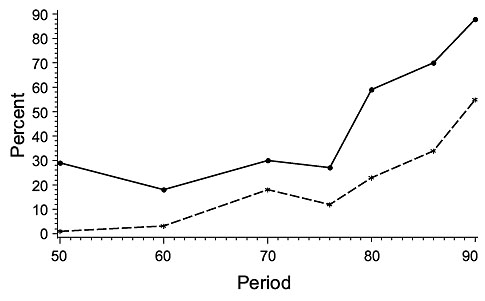 Fig. 6 Mean percentage of cod, haddock and plaice in deep strata (>274 m) (dashed line) and percentage of bottom temperatures < 0 0 C (solid line) in A. Index Strata (36–274 m) and B. Non-Index Strata with depths similar to those in the Index Strata for subdivision 3Ps. Period indicates the beginning of each period. See text for a list of periods used. Fig. 6 Mean percentage of cod, haddock and plaice in deep strata (>274 m) (dashed line) and percentage of bottom temperatures < 0 0 C (solid line) in A. Index Strata (36–274 m) and B. Non-Index Strata with depths similar to those in the Index Strata for subdivision 3Ps. Period indicates the beginning of each period. See text for a list of periods used. |
Myers and Worm (2003) fitted exponentially declining curves to their combined abundance estimates for Gadoid and Pleuronectid species for the St. Pierre Bank, and southern Grand Bank populations from about 1950, and attributed the declines to the effects of the development of industrialized fishing. However, a subsequent study (Halliday and Pinhorn, 2009) found the weight of evidence favoured environmental changes, associated with variations in the North Atlantic Oscillation, as the primary factor driving large scale variations in the productivity of Northwest Atlantic groundfish population.
Acknowledgements
The authors are deeply grateful to Mr. Eugene Murphy and Mr. William Brody, both of DFO, for provision of the research vessel survey data on cod, haddock, plaice and yellowtail. Without their assistance this paper would not have been possible. We would also like to thank Mr. Dave Kulka, who reviewed an earlier draft of the paper.
References
ATKINSON, D. B., G. A. ROSE, E. F. MURPHY, and C. A. BISHOP. 1997. Distribution changes and abundance of northern cod (Gadus morhua) 1981–1993. Can. J. Fish. Aquat. Sci. 54: 132–138. DOI: 10.1139/cjfas-54-S1-132. DOI: 10.1139/f96-158
BRATTEY, J., N. G. CADIGAN, B. P. HEALEY, G. R. LILY, MURPHY, E. F., P. A. SHELTON, D. F. STANSBURY and J.-C. MAHÉ. 2002. An assessment of the cod (Gadus morhua) stock in NAFO Subdivision 3Ps in October, 2002. Canadian Science Advisory Secretariat (CSAS) Res. Doc. No. 2002/96, 103 p.
CASEY, J. M. 2000. Fish community changes in an exploited marine ecosystem: Newfoundland Southern Grand Bank and St. Pierre Bank, 1951–1995. M.Sc. Thesis. Memorial University of Newfoundland, 110 p.
DOUBLEDAY, W. G. 1981. Manual on groundfish surveys in the Northwest Atlantic. NAFO Sci. Coun. Stud.2: 7–55.
DOUBLEDAY, W. G. and D. RIVARD (eds). 1981. Bottom trawl surveys. Can. Spec. Publ. Fish. Aquat. Sci. No. 58, 273 p.
GAVARIS, S. and W. B. BRODIE. 1984. Results of comparative fishing between the A.T. Cameron and the Wilfred Templeman during July–August 1983. Canadian Atlantic Fisheries Scientific Advisory Committee (CAFSAC) Res. Doc. No. 41, 16 p.
EDWARDS, R. L. 1968. Fishery resources of the North Atlantic area. In: The Future of the Fishing Industry of the United States. D. W. Gilbert (Ed.). University of Washington. p. 52–60.
FRECHET, A. and Y. GAGNON. 1993. Changes in distribution and failure of the winter fixed gear cod (Gadus morhua) fishery off southwestern Newfoundland. NAFO Sci. Coun. Stud. 18: 71–77.
HALLIDAY, R. G. and A. T. PINHORN, 2009. The roles of fishing and environmental change in the decline of Northwest Atlantic groundfish populations in the early 1990s. Fish. Res. 97: 163–182. DOI: 10.1016/j.fishres.2009.02.004
KULKA, D. W., J. S. WROBLEWSKI and S. NARAYANAN, 1995. Recent changes in the winter distribution and movements of northern Atlantic cod (Gadus morhua) on the Newfoundland-Labrador shelf. ICES J. Mar. Sci. 52: 889–902. DOI: 10.1006/jmsc.1995.0086
KULKA D. W, A. T. PINHORN, R. G. HALLIDAY, D. PITCHER and D. STANSBURY. 1996. Accounting for changes in spatial distribution of groundfish when estimating abundance from commercial fishing data. Fish. Res. 28/3: 321–342. DOI: 10.1016/0165-7836(96)00508-5
MYERS, R. A. and B. WORM, 2003. Rapid worldwide depletion of predatory fish communities. Nature. 423: 280–283. DOI: 10.1038/nature01610
PITT, T. K., R. WELLS and W. D. MCKONE. 1981. A critique of research vessel surveys by the St John’s Research and Resource Services. In: Bottom Trawl Surveys. Doubleday, W.G. and D. Rivard (eds) Can. Spec. Publ. Fish. Aquat. Sci. 58, p. 42–61.
POPE, J. G., 1972. An investigation of the accuracy of virtual population analysis. Int. Comm. Northwest Atl. Fish. Res. Bull. 9: 65–74.
POWER, D., J. MORGAN, E. F. MURPHY, J. BRATTEY and B. HEALEY. 2010. An assessment of the cod stock in NAFO Divisions 3NO. NAFO SCR Doc., No. 42, 52 p.
TEMPLEMAN, W. 1966. Marine Resources of Newfoundland. Ottawa: Fisheries Research Board of Canada, 1966. Bulletin No. 154.
TEMPLEMAN, W, V. M. HODDER and R. WELLS, 1978. Age, growth, year-class strength and mortality of the haddock, Melanogrammus aeglefinus, on the southern Grand Bank and their relation to the haddock fishery of this area. ICNAF Res. Bull. No. 13, p. 31–52.
TEMPLEMAN, W. and C. A. BISHOP. 1979. Age, growth, year-class strength and mortality of haddock, Melanogrammus aeglefinus, on St. Pierre Bank in 1948–75 and their relation to the haddock fishery of this area. ICNAF Res. Bull. No. 14, p. 85–99
WILLIAMSON, G. R. 1965. Age, growth, sexual maturity and mortality of cod on the Grand Bank of Newfoundland and St. Pierre Bank, 1946–62. PhD thesis, London University, 140 p.
|