1. Introduction
Determination of the reproductive potential (RP) of a population is an important aspect of fish stock assessment. The potential to produce recruits is a major component of population productivity and thus has a large impact on the resilience of a population. Spawning stock biomass (SSB) is often used as the measure of RP as a predictor of recruitment produced. However, SSB may not be the best metric of RP because reproductive potential may not be proportional over time to the spawning stock biomass (Marshall et al., 1998; Scott et al., 2006; Morgan, 2008; Marshall, 2009). Measures of SSB commonly assume biological processes are invariant. However, maturity, sex ratio, fecundity and/or parental condition are known to vary and this may play an important role in variation in egg production. Integrating variation in biological process into our metrics of RP may help to explain variability in recruitment (Marshall et al., 2006; Morgan et al., 2009).
The incorporation of more biological realism into indices of RP affects our perception of the status of populations (Morgan and Brattey, 2005; Marshall et al., 2006; Morgan et al., 2009; Murua et al., 2010). It can also improve estimation of recruitment (Marteinsdottir and Thorarinsson, 1998; Murawski et al., 2001; Kraus et al., 2002). However, this may depend on the stock being examined either because some populations have shown little trend in factors such as maturation and fecundity and/or because the data used to estimate alternative indices of RP are of poor quality or time series are lacking (Tomkiewicz et al., 2003; De Oliveira et al., 2006; Morgan et al., 2011).
Since the perception of stock status and productivity can be affected by the choice of RP index, this could be an important consideration when rules for determining appropriate levels of harvest are developed. Such rules can be tested using management strategy evaluation (MSE, Kell et al., 2007). However, when conducting a Management Strategy Evaluation (MSE), alternative RP indices are often not incorporated (Murua et al., 2010).
An MSE was conducted for the Greenland halibut (Reinhardtius hippoglossoides) stock on the Newfoundland shelf in the Northwest Atlantic (Miller et al., 2008; Shelton and Miller, 2009). Greenland halibut is an important flatfish resource which has had catches in excess of 60 000 t (Healey et al., 2010). The population declined to very low levels in the mid 1990s and a MSE was conducted to evaluate various harvest control rules (HCR) to recover the stock (Shelton and Miller, 2009). The Greenland halibut MSE was extensive with two sets of operating models (OM) conditioned on two different population models. Several different stock recruit (S/R) relationships were considered, as well as different levels of natural mortality and fishery selectivity. Varying growth was considered in the MSE but not possible variation in maturation, sex ratio and fecundity (Miller et al., 2008). Thus it is not known whether the HCR adopted by the NAFO Fisheries Commission (NAFO, 2010a) is robust to the inclusion of information on sex ratio and fecundity into RP.
There have been few tests of whether HCRs are robust to the inclusion of more biological realism into the measures of RP. De Oliveira et al. (2010) found that estimates of SSB and fishing mortality were biased when the variation in fecundity was not taken into account in the assessment of western horse mackerel (Trachurus trachurus). Although the inclusion of more biological information affected the estimation of the biological reference points (BRPs) and the status of the stock in relation to those biological reference points, Murua et al. (2010) found that the HCR for European hake (Merluccius merluccius) was robust to the exclusion of more biological information in the indices of RP. Variability in reproductive biology may play an important role in understanding the underlying mechanisms regulating the annual recruitment, but incorporating more biological realism into a forecast model could multiply the uncertainty in forecasts.
Our objective was to test whether the current HCR for the Greenland halibut stock in NAFO Subarea 2 Division 3KLMNO is robust to different measures of RP combined with different assumptions about the stock recruit relationship. We focus on a set of OM based on the current assessment view (CAV) OMs used in the Greenland halibut MSE (Shelton and Miller, 2009; NAFO, 2010b). CAV is most closely consistent with the 2010 NAFO Greenland halibut accepted assessment model (Healey et al., 2010). We test the HCR using alternative stock recruitment functions with different RP indices which vary in their level of biological complexity (incorporating sex-ratio and fecundity).
2. Material and methods
To allow the direct comparison of our results with those obtained in the 2010 NAFO Greenland halibut MSE (NAFO, 2010b), the simulations run in this analysis were conducted precisely as were done in 2010 and all the data used with the exception of the RP indices used in determining future recruitment were the same.
2.1. The simulation algorithm
The simulation algorithm used in this document is the same used in the development of the NAFO Greenland halibut Management Strategy Evaluation (Miller et al., 2007; Miller et al., 2008; Shelton and Miller, 2009) adopted by the NAFO Fisheries Commission in 2010 (NAFO, 2010a). The conceptual framework for MSE, adapted from Kell et al. (2007), comprises an operating model and a management strategy/procedure model. The operating model (OM) simulates the ‘real or true system’ (i.e. the biological population and the fishery, their interaction and the implementation of the management advice) and the Management Strategy (MS) simulates how the management advice is determined through the HCR. This simulation algorithm explicitly or implicitly acknowledges different sources of uncertainty in both the “real” system and the management procedure (Rosenberg and Restrepo, 1994; Francis and Shotton, 1997; Kell et al., 2007). The real biological population and fishery are projected, in yearly time steps, using the OM, and the MS is applied annually to produce the management advice (total allowable catch) for the next year. The Greenland halibut MSE takes into account historical uncertainty in the form of observation error through an XSA bootstrap procedure (Miller and Shelton, 2007). Process error (variation in weights at age, partial recruitment at age and number of recruits) was also taken into account. In the Greenland halibut MSE, no management implementation error (i.e. TAC over/under-runs) was considered after 2010, the start of the simulation.
2.1.1. The initial population
The initial random population is generated based on the 2010 assessment carried out with XSA (Healey et al., MS 2010) but replacing the observed abundance indices by a set of 500 bootstrapped abundance indices. To generate abundance indices from the XSA for each bootstrap iteration, a nonparametric bootstrap resampling within each age and index was conducted (Miller and Shelton, 2007).
Greenland halibut matures at an old age (>10), and as a slow growing species, they likely live well beyond age 14, the plus group age in the assessment. Given that most of the reproductive potential was included in the 14+ plus group and all the fish are mature by age 20, it was decided to expand the age structure of the “true” population in the OM to age 20 (age 20+ as a plus group). The plus group numbers for each year estimated in the assessment were then expanded out to age 20+ based on the assumption that the PR (selectivity to the commercial fishery) for the older ages is equal to that of age 13 (Miller et al., MS 2008). Natural mortality was assumed constant for all ages and years and equal to 0.2. The weights at age matrix for years 1975 to 2009 was the same used in the in the 2010 NAFO Greenland halibut MSE. The weights at age for years 1975 to 2009 (up to age 13) were taken from the XSA inputs (based on commercial catch data) in Healey et al. (MS 2010). The weights at age (1975–2009) for ages older than 13 years old were calculated by Miller with the method explained in Miller et al. (MS 2007).
2.1.2. The operating models
The Operating Models (OMs) tested in this study were based on three different Stock/Recruitment (S/R) relationships: segmented regression, the Ricker S/R model, and a modified Ricker. The S/R relationships were fitted using the numbers at age 1 in the initial population and the different RP indices (as calculated in section 2.1.3) for the period 1975–2006 in each of the iterations to avoid the uncertainty in the last years XSA recruitment results, as it was made in Miller et al. (2008). Best fits for all S/R relationships were calculated by minimising the log residual sums of squares (SS). The Ricker S/R model led to very low recruitment at high values of RP causing extreme fluctuations at high stock size as a result of strong density dependent compensation. Therefore it was decided to implement the modified Ricker S/R OM where the recruitment does not decline below a specified level at high indices of RP. In the modified model, for estimates of RP above the maximum historically observed, recruitment is set as the recruitment estimated by the Ricker function (plus an error term) for the highest observed RP. Similar to Shelton and Miller (MS 2009), the OM based on the segmented regression was called Current Assessment View (CAV), the OM based on the Ricker function was called CAV_Ric and the OM based on the modified Ricker model was called CAV_mRic. CAV is most consistent with the accepted assessment model and is the same XSA CAV OM tested in the Greenland halibut MSE (Shelton and Miller, 2009).
Twelve OMs, resulting from the combination of four RP indices (see below) with the three S/R described above, were tested. These OMs consist of an age-structured biological population and a single fishery inducing fishing mortality during the harvesting process. Each OM starts in 2010 and for this year the population numbers of age two and older are calculated using the numbers and fishing mortalities obtained in the generation of the initial population while the recruits at age one are estimated using the different S/R relationships described above with a lognormal multiplicative random error with autocorrelation. This error was bootstrapped each year and iteration from the observed errors of the best fit of each S/R relationship. The parametric forms of each S/R model to estimate the projections recruitment were the following:
Segmented regression:

Ricker:

Modified Ricker:
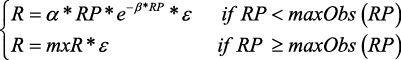
Where:
Ris the estimated recruitment.
α
and β are the parameters of the functions.
maxObs (RP) is the maximum observed RP value for years 1975–2005
mxR is the recruitment estimated by the function for maxObs (RP) in the observed years.
εis the lognormal multiplicative random error with autocorrelation.
In subsequent years, the population numbers are carried forward using the exponential survival equation. Implementation error was only applied in 2010. For 2010 the catch level was the TAC (16 000 t) plus the observed TAC overrun resampled from the period 2004–2009.

For the other years projected, the TAC is caught exactly, unless there is not enough exploitable biomass to support such a TAC, in which case a value of 1 for the mean F for ages 1–20 is applied.
The selectivity of the fishery in the projected years is resampled from the selectivity observed in the period 1997–2006. Weights for projected years were resampled by year (all ages), from the period 2000 to 2009. Female maturity, sex ratio and fecundity in the calculated RP indices in the projections were taken without uncertainty and equal to the 2010 values as was done in the 2010 Greenland halibut MSE.
2.1.3. Indices of reproductive potential
Data on maturity, sex ratio and fecundity were collected from Canadian research vessel bottom trawl surveys conducted in autumn from 1978 to 2010. Survey data from Div. 2J and 3K only were used as these areas had the most consistent coverage of the deep water areas inhabited by Greenland halibut.
Proportion mature at age was estimated by cohort, using generalized linear models with a logit link function and binomial error. Age was treated as a continuous variable since in general it is not possible to have a lower proportion of adults at age a+1 than at age a, that is once a fish becomes an adult it will always be an adult (Morgan and Colbourne, 1999). All ages were used in the fitting. There were significant model fits for cohorts 1966–1983, 1985–1986, 1988–1992, 1994 and 1996–1998. For cohorts where there was no significant model fit to the data, the averages of estimates from adjacent cohorts or from the three closest cohorts were used.
Sex ratio (proportion female) at age was also estimated using generalized linear models with a logit link function and binomial error. These models had the form sex ratio = age + cohort, where age and cohort were both class variables. In this case age was treated as a class variable since there is no a priori reason to believe that sex ratio would change continuously across age (Morgan and Brattey, 2005). In order to produce reasonable estimates of proportion female for a particular age and cohort, a sufficient number of age samples were required. For example, if there were only two observations for a cohort at a particular age, then the proportion female could only be 0, 0.5 or 1. Therefore, we used only ages 3 to 14 in the model fitting and only included an age/cohort combination if there were at least 5 observations. Sufficient data were available to fit the model to cohorts from 1969–2001.
Fecundity data were limited. A fecundity/length relationship based on data collected in 1976–77 (Bowering, 1980) was used for those years. For 1986 unpublished data were used (r2sup>=0.43 for fit of model to data) and for the other years a combination of these two relationships was used. The relationships were:
- For 1976–1977: F=0.0623*(Length^3.082)
- For 1980: F= 0.0018*(Length^3.8263)
- For all other years: F=0.01064*(Length^3.454)
The fecundity length relationships were applied to mean length at age to produce egg production at age. The lengths at age used are the same as in the 2010 assessment and previous MSE work and are based on commercial samples which in most years come from a winter fishery. However, they were for sexes combined and thus could deviate from true female weight or length. Fecundity was determined mostly by size so age was not included in the modeling (Lambert et al., 2003).
These estimates of maturity, sex ratio and fecundity were used along with the weights and numbers at age to produce four different Reproductive Potential (RP) indices. The different RP indices were:
B10+, the biomass for ages more than 9 years old as proxy of SSB where Nay is the population number-at-age a in year y and Way the weight-at-age a in year y. This index has been used in the past as proxy for SSB in the assessment of this stock.

SSB, the spawning stock biomass using maturity ogives estimated by cohort applied to the total biomass where May is the proportion mature-at-age a in year y.

FSB, the female spawning biomass estimated using maturity ogives estimated by cohort applied to female biomass where Ray is the proportion of female-at-age a in year y.

TEP, the total egg production, incorporating a proxy for realized fecundity-at-age where Eay is the egg production at age a in year y calculated as described above.

2.1.4. The management strategy
The MS was first applied in 2010 and led to the first TAC advice for 2011 based on the Harvest Control Rule (HCR) approved by the Fisheries Commission in 2010 (NAFO, 2010a). The same HCR is applied every year up to 2030. The MS model is divided in two steps: (i) the OM which simulates the data collection (the surveys indices) (ii) the management decision model which uses a HCR based on the surveys indices to derive management advice. In the OM the abundance indices for all ages are generated with a multiplicative random error assuming a linear relationship between survey abundance at age and abundance at age in the true population (constant q):

Where: Iy,a is the simulated survey index for a particular survey, age and year
qa is the estimated catchability for a particular survey and age
Ny,ais the OM abundance for a particular age and year.
ε is the bootstrapped observed catchability error from each particular survey, age and period.
The TAC for year y+1 is set based on the survey indices observed in the period y-5 to y-1 with the HCR based on a simple TAC adjustment strategy that uses the change in perceived status of the stock (from research surveys) to adjust the TAC:

Where: slope = average slope of log-linear regression lines fit to the last five years of each of the three survey biomass indices (equally weighted).
The λ values are: 2 if the slope is negative and 1 if the slope is positive.
The HCR includes a constraint such that the TAC from 2012 onwards does not change by more than 5% from the previous year. The starting value for the TAC was set at 17 500 t.
2.1.5. Performance Targets
The HCR was evaluated using several performance targets (PT)
- The probability of the decline of 25% or more in terms of exploitable biomass from 2011 to 2016 is kept at 10% or lower.
- The magnitude of the average TAC in the short (2015), medium (2020) and long (2030) term should be maximized.
- The probability of failure to meet or exceed a milestone within a prescribed period of time should be kept at 25% or lower. Milestone means the average exploitable biomass for the period 1985–1999 (106 000 t.) to be compared with the exploitable biomass in 2031.
The PTs and their correspondent performances statistics (PS) were established in the Greenland halibut MSE (NAFO, 2010b). In this study a fourth PS is included related to fishing mortality. Although there are currently no precautionary approach fishing mortality reference points for this stock, the annual probability of the F being greater than the annually estimated Fmax was included as a proxy for P(F>Flim). There is no approved Fisheries Commission target for this statistic but less than 10% probability is considered a very low probability in the NAFO Precautionary Approach framework and we take this probability level as our target.
3. Results
3.1. Biological variables by age
Variation in female maturity at age by cohort was evident (Fig. 1) with a clear pattern over time with cohorts from the 1980s on generally maturing at a younger age than those of the 1970s. There was a trend of increasing proportion of females over time, although most of the change was in age classes at which very few females are mature (less than age 14). Fecundity has also varied over time, with some trend to lower fecundity since about 2000. Since fecundity data are limited, most of the change in fecundity actually reflects changes in mean length at age. The low egg production for an age 12 individual in 1980 is the result of the small length of age 12 individual in that year.
The proportion female at age is more or less constant around 0.5 until age 7 (Fig. 2). Proportion female then clearly increases from age 8 to age 12 and for older ages the proportion female is almost 1. This reflects differential longevity and probably growth, maturity and mortality patterns between females and males. The variability in the proportion female is low for all ages in absolute terms but was as much as 20% for some ages. The estimated proportion mature at age is essentially zero for ages younger than 10, and increases to one by about age 18. The ages over which the fish mature (mainly 11–17) show substantial variation. Fecundity at age shows a clear increasing trend from age 5 onwards. This is the result of the increase in fecundity with length. The variability by age is quite low until age 15 and increases from age 16 to 20.
3.2. Indices of Reproductive Potential
The trends in RP indices are very similar with a decline to 1980 followed by a rapid increase to the early 1990s after which they all drop to 2006 before increasing to the end of the time series (Fig. 3). The main difference is that 10+ biomass reaches its maximum in 1991 while the other have their maximum in 1992. The main reason for this gap is that population numbers at 10+ were relatively high from the late 1980’s to the mid 1990’s, peaking in 1991 when the 10+ biomass has its maximum. However, the 1980 year class has a very steep increase in proportion mature at age and is estimated to be 97% mature at age 12, in 1992. This is in contrast to other cohorts that have mostly 10–25% mature at age 12. This results in indices of RP using proportions mature at age having their peak in 1992. SSB and FSB are very similar because most of the mature females are older than 13 years, where the proportion of females is almost 1, so that the inclusion of sex ratio does not result in much change. The TEP time series shows some deviation from the trends in SSB and FSB but is still very similar overall.
3.3. Stock recruitment relationships
The fits of the segmented regression to all the RP indices are very similar (Fig. 4). For all indices their level at the start of the projection (2010) is greater than the segmented regression break point (“β” parameter). For the Ricker S/R all the indices show a very similar fit with a strong compensation effect (Fig. 5). This strong compensation effect in the Ricker S/R function is driven by a small number of S/R pairs. The levels of all RPs at the start of the projection are close to those that produce the maximum recruitment.
Based on the Mean Absolute Error (MAE) and the Akaike Information Criterion (AIC), the Ricker S/R has a better fit to the data for 10+ biomass, SSB and FSB. For TEP the segmented regression and Ricker AIC and MAE values are very similar. In both segmented regression and Ricker the best fits were to the 10+ index followed by SSB, FSB and TEP (Table 1 and 2).
3.4. Stochastic results of the Operating Models using different Reproductive Potential (RP) indices
3.4.1 Operating Models based on the segmented regression (CAV)
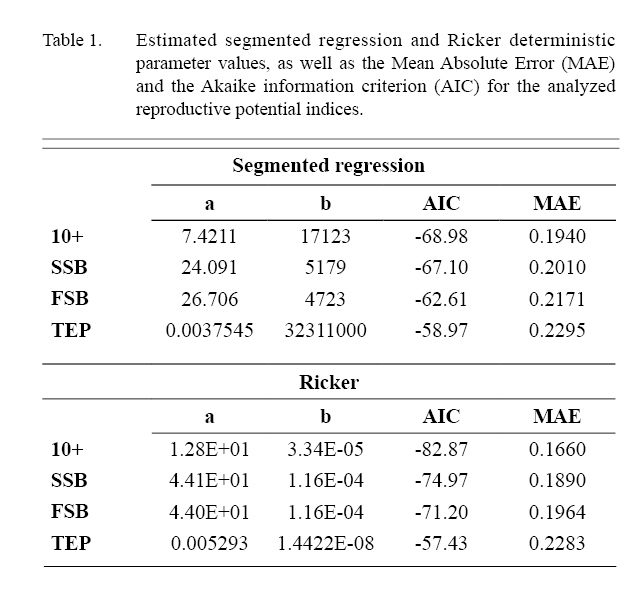
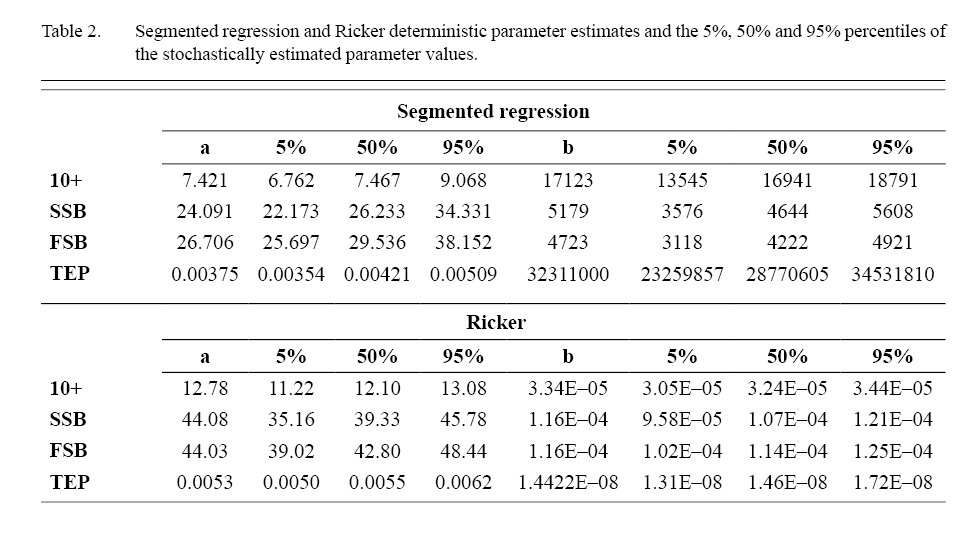
Table 1 and 2
|
The HCR has similar results for all RP scenarios in the CAV set of OMs, with their medians, 5th and 95th percentiles for biomass, fishing mortality, catch and recruitment showing very similar trajectories (Fig. 6). 5+ Biomass in the projected years shows a clear increasing trend reaching maximum values in the last year (2031) in all cases. All the RP scenarios show an increase in exploitable biomass (5–9) in the short term (2011–2016) reaching the exploitable biomass objective in 2017 for all the RPs. Table 3 presents the PS1 and PS3 results for each RP. The probability of the 2016 biomass being higher than the 2011 biomass (PS1) is very high (greater than 0.99) for the HCR in all of the RP scenarios. The probability of reaching the exploitable biomass objective in 2031 (PS3) is very high in all RP scenarios at more than 0.99. The exploitable biomass (5–9) time series shows an increasing trend from 2012 to 2018 after which it is more or less stable in all RP scenarios.
Fishing mortality shows a decreasing trend from 2012 to 2018 and after that is quite stable around 0.1 in all the scenarios under this stock recruitment assumption. The probability that the annual F is greater than the annual Fmax (PS4) is less than 0.1 in all projected years for all the RP scenarios (Table 4). All the RP scenarios also have very similar catch results in the short, medium and long term (Figs. 6 and 7); showing a slight increase until 2024 with stability after that.
3.4.2. Operating Models based on the Ricker S/R function (CAV_Ric)
All of the RP scenarios show a major decline in biomass over the projection period under the assumption of a Ricker S/R relationship, however the timing of the decline varies. All results for SSB and FSB are very similar (Fig. 8). Exploitable biomass (5–9) increases until about 2019 before declining, while 5+ biomass increases to 2023 and then declines. Fbar declines and then remains at a low level for most of the time series, while recruitment increases to about 2014 and then declines. The 10+ RP index results are similar to those for SSB and FSB particularly for Fbar and catch. Biomass and recruitment decline later in the projection period for 10+ biomass than for SSB and FSB.
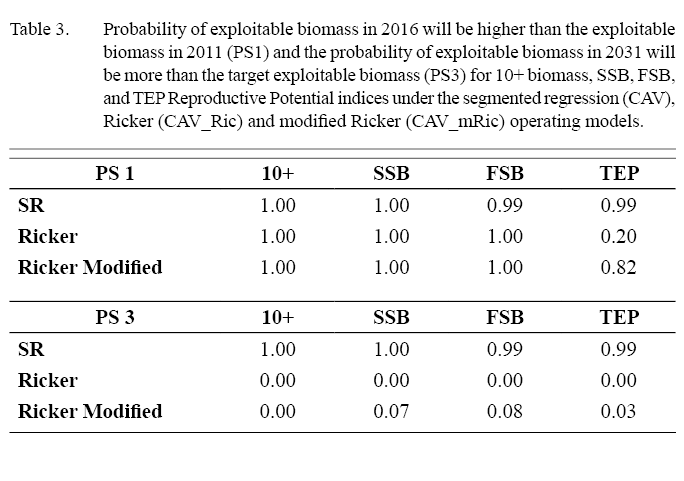

Table 3 and 4
|
The results for TEP are very different from the others. Recruitment rapidly declines to very low levels because the TEP index grows much faster than the other RP indices. This causes the recruitment to drop in a short period close to zero as the Ricker S/R model leads to very low recruitment at high values of RP. This causes extreme fluctuations at high stock size as a result of strong density dependent compensation. The recruitment remains at very low levels for a long period causing a collapse in biomass (Fig. 8). The subsequent increase in the recruitment is probably because some of the runs do not collapse completely and then when the TEP reduces significantly, high recruitment is observed. Fbar increases rapidly till the maximum imposed in the simulations and catch declines to zero. Catch for TEP in the medium and long term is much lower than for the other OMs under this S/R assumption (Fig. 9).
The probability that the 2016 exploitable biomass (5–9) is higher than the 2011 biomass (PS1) is very high for all RP scenarios, more than 0.99, except for TEP where this probability is only 0.2 (Table 3). The probability of reaching the exploitable biomass objective in 2031 (PS3) is very low, less than 0.01 for all RP indices under the Ricker function (Table 3). The probability of the annual F being larger than the annual Fmax (PS4) is less than 0.01 for 10+ biomass in all projected years (Table 4). For SSB and FSB it is less than 0.05 in almost all years, except the last projected years where it is 0.07 and 0.1, respectively. For TEP it is less than 0.01 in the short term (until 2017), starts to increase in the medium term period from 2018–2021 and from then to 2031 in all years is higher than 0.7.
3.4.3. Operating Models based on the modified Ricker S/R function (CAV_mRic)
As in OMs based on the other S/R functions, the results for the SSB and FSB scenarios are very similar (Fig. 10). 5+ biomass increases to the early 2020s before leveling off, while 5–9 biomass increases and then declines, levelling off below the management objective in the last 15 years of the projection. Early in the projection period recruitment is at a higher level and then declines to a lower level by 2020. Biomass and recruitment trends for the 10+ biomass OM are similar to those for FSB and SSB but at a higher level. Recruitment for TEP reaches a stable level very early in the projection period, 5+ biomass shows an increasing trend over the period while 5–9 biomass levels off below the management objective around 2017. The probability of the 2016 biomass being more than the 2011 biomass (PS1) is very high for all the RP indices at more than 0.99 except for TEP where this probability is 0.82 (Table 3). The probability of reaching the exploitable biomass objective in 2031 (PS3) is very low for all RP indices under the modified Ricker function. It is less than 0.05 for the 10+ biomass and TEP scenarios, and less than 0.10 in the SSB and FSB cases.
Fishing mortality shows a slight decreasing trend from 2012 to 2031 in all the scenarios. The probability of the annual Fbar being larger than the annual Fmax (PS4) is less than 0.01 in all scenarios from 2012 onwards (Table 4). All the RP indices scenarios in the short term have very similar mean catch results (Fig. 11). In the medium and longer term the catch for TEP is slightly lower than for the other scenarios.
4. Discussion
Choice of S/R function had a major impact on the results of Greenland halibut MSE. The HCR performed well on all OMs based on the segmented regression for all performance statistics, implying that the HCR is robust to the choice of RP used for this S/R model. The HCR failed to meet the long term target for exploitable biomass in the OMs based on the Ricker or modified Ricker function. The population dynamics in projected years is determined by the stock recruitment function and, thus, the selection of the stock recruitment form greatly affects the perceived robustness and performance of the HCR. The OMs based on the segmented regression assume constant recruitment above some level of the RP indices. The level of constant recruitment is similar, and high, for all the RP indices. Therefore, all OM reach the level of RP giving maximum recruitment early in the projection period, leading to similar results with a stable healthy population in all cases. However, in the Ricker based OMs the S/R function assumes that recruitment increases with increasing RP index to a maximum followed by a decline in recruitment due to compensatory mechanisms. For Greenland halibut this model leads to very low recruitment values at high values of RP which causes extreme population fluctuations at high RP. This large decline in recruitment is the cause of the drop in 5+ and exploitable biomass in all scenarios in the long/medium term. This scenario is not biologically reasonably because most the iterations collapse in the medium term and the posterior recovery is probably because some runs do not collapse completely and high recruitment will be observed when the TEP level decreases. Results in this case are mainly model artifacts. The compensatory reduction in recruitment should have a limit bigger than zero, but existing data do not allow this limit to be estimated. To solve this problem the modified Ricker function was developed. In the modified Ricker model used here, recruitment does not decline below a specified level at high indices of RP. However, it still has a strong density dependent compensatory mechanism resulting in low biomass at the end of the projected period.
Understanding the basis of uncertainty in the S/R relationships is generally the most difficult outstanding problem in fisheries assessment and management (Hilborn and Walters, 1992) and it is a key problem in the MSE. The Ricker S/R function fits the Greenland halibut data better than the segmented regression for all the RP indices, except for TEP where the fit statistics were very similar. The data clearly seem to follow a Ricker curve, with a decline in recruitment at high levels of RP. With the current adopted HCR, this may pose a problem for the provision of advice because high population biomasses lead to low recruitment and, thus, unexpected rapid deterioration of population status and level of catches when population biomass is high. As such, it seems to indicate that the population should not be allowed to increase above the level corresponding to maximum recruitment at around an RP level (30 000 tones for 10+). However the better fit of the Ricker to the data is driven mainly by 3 or 4 stock recruit pairs at high stock size. The exact form of the S/R function is uncertain. Thus, it would be prudent to allow the population to increase until the shape of the S/R function is confirmed. If the Ricker is confirmed, where recruitment decreases above a specific level of RP, the current HCR adopted for GHL will be overly optimistic and a deterioration of population status, and decrease in yield, will be expected in the short term. The results in all OMs should be interpreted with some caution as they rely on recruitment obtained from the extrapolation of the fitted stock-recruit curves well beyond the maximum observed RPs indices values. In all OMs, all the RP indices, except the TEP under the Ricker function, reach the maximum observed (1975–2010) RP value in 2020 and grow until the end of the forecast period. Recruitment levels after 2020 are therefore more uncertain and in consequence the long term results of the management strategies obtained should be interpreted with caution. Despite this, it can be concluded that the current adopted HCR is not robust to the selection of different S/R relationships, which have a great impact on the performance of the HCR, and, thus, this issue should be explored further in the next revision of the HCR of GHL.
The results show that for Greenland halibut data the inclusion of more biological information when estimating the reproductive potential does not improve the S/R fit either for the segmented regression or the Ricker. The best fits in both cases were inversely related to the degree of biological complexity being best for 10+ biomass followed by SSB, FSB and TEP. These results are similar to those found by Marshall et al. (2006), Morgan (2008) and Murua et al. (2010), who showed that alternative and more complex RP indices did not always significantly improve the S/R relationship. Although there was variation in the biological inputs there were no strong trends over time. In addition, there are limitations with some of the data used to build the RP indices. Age determinations of Greenland halibut have long been considered highly uncertain (ICES, MS 1997; Alpoim et al., MS 2002; Treble and Dwyer, 2008) and recent results indicate a tendency to underestimate the age of older individuals (Gregg et al., 2006; Treble et al., 2008). There are many examples from other species where systematic underestimation of age has resulted in failure to realize the stock’s vulnerability to exploitation (Campana, 2001), and for many deep-water species this has led to sudden declines of stocks as well as the fishery that they supported. Maturities were determined macroscopically; based on a classification scheme that likely over estimates maturity at age (Rideout et al., 2012) and that may not detect trends. Fecundity data are limited so that variation in fecundity at age is really mainly driven by variation in mean length at age. Further it is often assumed that iteroparous fishes spawn annually once reaching sexual maturity, but this is not always the case. Skipped spawning has been reported for Greenland halibut by Walsh and Bowering (1981). There are also indications that ovarian development in Greenland halibut could last more than one year, which also implies that the Greenland halibut does not spawn every year (Albert et al., 2001; Junquera et al., 2003). All of these factors may affect the quality of the indices of RP making them less useful to improve the S/R relationships (Morgan et al., 2011). In addition, variability in maturity, sex ratio and fecundity was not included in the projections. This, combined with quality issues related to the biological inputs, makes the use of different indices of RP less likely to impact the MSE (DeOliveira et al., 2006, 2010).
All the OMs based on the segmented regression have very similar results and seem to be robust to assumptions about RP. However, there was variability in the results of the different indices of RP in the Ricker and modified Ricker OMs and some impact on whether performance statistics were met. In particular, TEP had a higher probability of failing to maintain Fbar below Fmax than the other OM under the Ricker S/R function. In general though, the choice of S/R function had a greater impact than the inclusion of more biological information in the index of RP. Murua et al. (2010) also found little impact of using more complex indices of RP on the MSE for Northern European hake. In that case, stock biomass was at a high level and any variation introduced by using different indices of RP had little impact. In the case of Greenland halibut the projection period began when the population was at a relatively low level. However, recruitment at the starting biomass level was at or near maximum for the segmented regression and near the peaks of the Ricker curves due to the rapid increase in recruitment at low levels of the RP indices for all assumed S/R functions. This resulted in near maximum recruitment at the start of the projections for most OMs. The inclusion of alternative indices of RP is likely to have more impact in stocks with depleted reproductive capacity and/or where alternative indices have a greater effect on the S/R relationships.
Acknowledgements
This research was partially funded by the Canadian – Spanish cooperation founds under the scientific project “Analysis of Stock Reproductive Potential to promote sustainability of Greenland Halibut fishery” carried out by the following institutions: Fisheries and Oceans Canada, Institute of Marine Research (CSIC), Spanish Institute of Oceanography (IEO) and AZTI Foundation. This paper is contribution no 752 from AZTI-Tecnalia (Marine Research Department). Our gratitude is extended to all personnel involved in the collection and preparation of data used in this document. Two anonymous reviewers provided helpful comments on a previous version of the MS.
References
ALBERT, O. T., E. M. NILSSEN, A. STENE, A. C. GUNDERSEN, and K. H. NEDREAAS. 2001. Maturity classes and spawning behavior of Greenland halibut (Reinhardtius hippoglossoides). Fish. Res. 51(2–3): 217–228. doi.org/10.1016/S0165-7836(01)00247-8
ALPOIM, R., A. AVILA DE MELO, R. BANON, M. CASAS, S. CERVINO, S. JUNQUERA, I. MARTIN, H. MURUA, X. PAZ, G. PEREZ-GANDARAS, J. L. DEL RIO, E. RODRIGUEZ-MARIN, F. SABORIDO-REY, E. J. DOS SANTOS, and A. VAZQUEZ. MS 2002. Distribution and main characteristics of fish species on Flemish Cap based on the 1988–2002 EU Surveys in July. NAFO SCR Doc., No. 72, Serial No. N4685, 73 p. www.nafo.int/Portals/0/PDFs/sc/2002/scr02-072.pdf
BOWERING, W.R. 1980. Fecundity of Greenland halibut, Reinhardtius hippoglossoides (Walbaum), from southern Labrador and southeastern Gulf of St. Lawrence. J. Northw. Atl. Fish. Sci., 1: 39–43. doi.org/10.2960/J.v1.a3
CAMPANA, S. E. 2001. Accuracy, precision and quality control in age determination, including a review of the use and abuse of validation methods. J. Fish Biol., 59: 197–242. doi.org/10.1111/j.1095-8649.2001.tb00127.x
DE OLIVEIRA, J. A. A., B. A. ROEL, and M. DICKEY-COLLAS. 2006. Investigating the use of proxies for fecundity to improve management advice for western horse mackerel Trachurus trachurus. ICES J. Mar. Sci., 63: 25–35. doi.org/10.1016/j.icesjms.2005.07.006
DE OLIVEIRA, J. A. A., C. D. DARBY, and B. A. ROEL. 2010. A linked separable-ADAPT VPA assessment model for western horse mackerel (Trachurus trachurus, accounting for realized fecundity of fish weight. ICES J. Mar. Sci., 63: 916‒930. doi.org/10.1093/icesjms/fsp290
FRANCIS, R. I. C. C., and R. SHOTTON. 1997. “Risk” in fisheries management: a review. Can. J. Fish.Aquat. Sci., 54: 1699–1715. doi.org/10.1139/f97-100
GREGG, J. L, D. M. ANDERL, and D. K. KIMURA. 2006. Improving the precision of otolith-based age estimates for Greenland halibut (Reinhardtius hippoglossoides) with preparation methods adapted for fragile sagittae. Fish. Bull., 104: 643–648.
HEALEY B. P., J.-C. MAHÉ, and M. J. MORGAN. 2010. An Assessment of Greenland Halibut (Reinhardtius hippoglossoides) in NAFO Subarea 2 and Divisions 3KLMNO. NAFO SCR Doc., No. 10/40 Ser. No. N5799.
HILBORN, R. and C. J. WALTERS. 1992. Quantitative Fisheries Stock Assessment: Choice, Dynamics and Uncertainty. Chapman and Hall, New York. doi.org/10.1007/978-1-4615-3598-0
ICES. MS 1997. Report of the ICES/NAFO workshop on Green-land halibut age determination. ICES CM 1997/G:1, 53 p.
JUNQUERA, S., E. ROMAN, J. MORGAN, M. SAINZA, and G. RAMILO. 2003. Time scale of ovarian maturation in Greenland halibut (Reinhardtius hippoglossoides, Walbaum). ICES J. Mar. Sci. 60(4): 767–773. doi.org/10.1016/S1054-3139(03)00073-0
KELL, L.T., I. MOSQUEIRA, P. GROSJEAN, J.-M. FROMENTIN, D. GARCIA, R. HILLARY, E. JARDIM, S. MARDLE, M. A. PASTOORS, J. J. POOS, F. SCOTT, and R. D. SCOTT. 2007. FLR: an open-source framework for the evaluation and development of management strategies. ICES J. Mar. Sci., 64: 640–646. doi.org/10.1093/icesjms/fsm012
KRAUS, G., J. TOMKIEWICZ, and F. W. KÖSTER. 2002. Egg production of Baltic cod (Gadus morhua) in relation to variable sex ratio, maturity, and fecundity. Can. J. Fish. Aquat. Sci., 59: 1908–1920. doi.org/10.1139/f02-159
LAMBERT, Y., N. A. YARAGINA, G. KRAUS, G. MARTEINSDOTTIR, and P. J. WRIGHT. 2003. Using environmental and biological indices as proxies for egg and larval production of marine fish. J. Northw. Atl. Fish. Sci.,33: 115–159. doi.org/10.2960/J.v33.a7
MARTEINSDOTTIR, G., and K. THORARINSSON. 1998. Improving the stock–recruitment relationships in Icelandic cod (Gadus morhua) by including age diversity of spawners. Can. J. Fish. Aquat. Sci. 55(6): 1372–1377. doi.org/10.1139/cjfas-55-6-1372
MARSHALL, C. T. 2009. Implementing information on stock reproductive potential in fisheries management: the motivation, challenges and opportunities. In: Fish reproductive biology. Implications for assessment and management. T. Jakobsen, M. J. Fogarty, B. A. Megrey, and E. Moksness (eds).Wiley-Blackwell West Sussex, UK. 429 + ix p. doi.org/10.1002/9781444312133.ch11
MARSHALL, C. T., O. S. KJESBU, N. A. YARAGINA, P. SOLEMDAL, and O. ULLTANG. 1998. Is spawner biomass a sensitive measure of the reproductive and recruitment potential of northeast Arctic cod? Can. J. Fish. Aquat. Sci., 55: 1766–1783. doi.org/10.1139/cjfas-55-7-1766
MARSHALL, C. T., C. L. NEEDLE, A. THORSEN, O. S. KJESBU,O. S., and N. A. YARAGINA. 2006. Systematic bias in estimates of reproductive potential of an Atlantic cod (Gadus morhua) stock: implications for stock–recruit theory and management. Can. J. Fish. Aquat. Sci., 63: 980–994. doi.org/10.1139/f05-270
MILLER D. C. M., P. A. SHELTON, B. P. HEALEY, M. J. MORGAN, and W. B. BRODIE. 2007. Management strategy evaluation for Greenland halibut (Reinhardtius hippoglossoides) in NAFO Subarea 2 and Divisions 3LKMNO. NAFO SCR Doc. No. 07/58. Serial. No. N5410.
MILLER D. C. M. and P. A. SHELTON. 2007. A nonparametric bootstrap of the 2006 XSA assessment for Greenland Halibut (Reinhardtius hippoglossoides) in NAFO Subarea 2 + Divisions 3KLMNO using Fisheries Libraries in R (FLR). NAFO SCR Doc. 07/59. Serial No. N5411
MILLER D. C. M., P. A. SHELTON, B. P. HEALEY, W. B. BRODIE, M. J. MORGAN, D. S.BUTTERWORTH, R. ALPOIM, D. GONZÁLEZ, F. GONZÁLEZ, C. FERNANDEZ, J. IANELLI, J.-C. MAHÉ, I. MOSQUEIRA, R. SCOTT, and A. VAZQUEZ. 2008. Management strategy evaluation for Greenland halibut (Reinhardtius hippoglossoides) in NAFO Subarea 2 and Divisions 3LKMNO. NAFO SCR Doc., No. 08/25. Serial. No. N5225.
MORGAN, M. J. 2008. Integrating reproductive biology into scientific advice for fisheries management. J. Northwest Atl. Fish. Sci., 41: 37–51. doi.org/10.2960/J.v41.m615
MORGAN, M. J., and J. BRATTEY. 2005. Effect of changes in reproductive potential on perceived productivity of three northwest Atlantic cod (Gadus morhua) stocks. ICES J. Mar. Sci., 62: 65–74. doi.org/10.1016/j.icesjms.2004.10.003
MORGAN, M. J., and E. B. COLBOURNE. 1999. Variation in maturity at age and size in three populations of American plaice. ICES J. Mar. Sci., 56: 673–688. doi.org/10.1006/jmsc.1999.0487
MORGAN, M. J., H. MURUA, G. KRAUS, Y. LAMBERT, G. MARTEINSDÓTTIR, C. T. MARSHALL, C. T., L. O’BRIEN,and J. TOMKIEWICZ. 2009. The evaluation of reference points and stock productivity in the context of alternative indices of stock reproductive potential. Can. J. Fish.Aquat. Sci., 66: 404–414. doi.org/10.1139/F09-009
MORGAN, M. J., A. PEREZ-RODRIGUEZ, and F. SABORIDO-REY. 2011. Does increased information about reproductive potential result in better prediction of recruitment? Can. J. Fish. Aquat. Sci., 68: 1361–1368. doi.org/10.1139/f2011-049
MURAWSKI, S. A., P. J. RAGO, and E. A. TRIPPEL. 2001. Impacts of demographic variation in spawning characteristics on reference points for fishery management. ICES J. Mar. Sci., 40: 1002–1014. doi.org/10.1006/jmsc.2001.1097
MURUA, H., I. QUINCOCES, D. GARCIA, and M. KORTA. 2010. Is the northern European hake, Merluccius merluccius, management procedure robust to the exclusion of reproductive dynamics? Fish. Res., 104: 123–135. doi.org/10.1016/j.fishres.2010.03.018
NAFO 2010a. 32nd ANNUAL MEETING - SEPTEMBER 2010. Working Group on Greenland Halibut Management Strategy Evaluation (WGMSE). Recommendations to Fisheries Commission. NAFO/FC Doc. 10/12. Serial No. N5824.
2010b. Report of the working group on Greenland halibut management strategy evaluation (WGMSE) 2 – 4 May 2010 Halifax, Nova Scotia, Canada. NAFO FC Doc. 10/5.
TREBLE, M. A., S. E. CAMPANA, R. J. WASTLE, C. M. JONES, and J. BOJE. 2008. Growth analysis and age validation of a deepwater Arctic fish, the Greenland halibut (Reinhardtius hippoglossoides). Can. J. Fish. Aquat. Sci., 65: 1047–1059. doi.org/10.1139/F08-030
TREBLE, M. A., and K. S. DWYER. 2008. Report of the Greenland halibut (Reinhardtius hippoglossoides) Age Determination Workshop. NAFO Sci. Coun. Studies, 41: 1–96. doi:10.2960/S.v41.m1
RIDEOUT, R. M., M. J. MORGAN, Y. LAMBERT, A. M. COHEN, J. H. BANOUB, and M. TREBLE. 2012. Oocyte development and vitellogenin production in Northwest Atlantic Greenland halibut Reinhardtius hippoglossoides. J. Northw. Atl. Fish. Sci., 44: 15–29. doi.org/10.2960/J.v44.m679
ROSENBERG, A. A., and V. R. RESTREPO. 1994. Uncertainty and risk evaluation in stock assessment advice for US marine fisheries. Can. J. Fish. Aquat. Sci., 51: 2715–2720. doi.org/10.1139/f94-271
SCOTT, B. E., G. MARTEINSDOTTIR, G. A. BEGG, P. J. WRIGHT, and O. S. KJESBU. 2006. Effects of population size/age structure, condition and temporal dynamics of spawning on reproductive output in Atlantic cod (Gadus morhua). Ecol. Model., :383–415. doi.org/10.1016/j.ecolmodel.2005.05.015
SHELTON P. A., and D. C. M. MILLER. 2009. Robust management strategies for rebuilding and sustaining the NAFO Subarea 2 and Divs. 3KLMNO Greenland halibut fishery. NAFO SCR DOC., No. 09/037. Serial. No. N5673.
TOMKIEWICZ, J., M. J. MORGAN, J. BURNETT, and F. SABORIDO-REY. 2003. Available information for estimating reproductive potential of Northwest Atlantic groundfish stocks. J. Northw. Atl. Fish. Sci., 33: 1–21. doi.org/10.2960/J.v33.a1
WALSH S. J., W. R. BOWERING. 1981. Histological and visual observations on oogenesis and sexual maturity in Greenland halibut off northern Labrador. NAFO Scientific Council Studies, 1: 71–75.
|