|
Introduction
Many marine mammals are top predators and consequently should be a significant factor in structuring marine ecosystems, but attempts to evaluate their role have often been inconclusive owing in part to the generalized nature of their diets (Bowen, 1997; Bax, 1999). Nonetheless, the subject of marine mammal predation remains controversial. In the northwest Atlantic, populations of harp (Phoca groenlandica) and grey seals (Halichoerus grypus) are at their highest levels since early in the current century (Hammill and Stenson, 2008; Thomas et al., 2008). Harp seals alone appear to be responsible for about 80% of the ≈3 million tonnes of fish consumed by pinnipeds in Atlantic Canada (Hammill and Stenson, 2000). This has lead to suggestions that high seal numbers are hindering the recovery of groundfish stocks and that their numbers should be reduced (FRCC, 1999).
Evaluating predation by marine mammals on commercial stocks requires information on total consumption, which must then be examined within the context of mortality from other sources of natural and fishing mortality. Some studies have shown that consumption by marine mammals can exceed human harvests by a substantial amount (Trites et al., 1997; Kenney et al., 1997), and that they can have a significant impact on commercial fisheries particularly under conditions of reduced biomass (Trszinski et al., 2006; Morisette et al., 2008; Chassot et al., 2009).
Estimating the annual food consumption begins by evaluating individual energy requirements taking into account age and sex related differences and extrapolating these estimates to the total population. Beginning in the early 1980s, several models were developed to estimate energy requirements and hence food consumption of seals (Lavigne et al., 1982, 1985; Øritsland and Markussen, 1990; Markussen and Øritsland, 1991; Ryg and Øritsland, 1991; Nilssen et al., 2000). Since then, our information on growth (Worthy, 1987a, b; Chabot and Stenson, 2002), seasonal changes in body size and composition (Beck et al., 1993; Chabot and Stenson, 2002, Stenson and Chabot, DFO, unpublished data), energetic costs associated with reproduction (e.g. Lydersen and Kovacs, 1996), locomotion (e.g. Williams, 1999) and moult (e.g. Ashwell-Erickson et al., 1986; Slip et al., 1992) in pinnipeds has improved remarkably. Intuitively, it would appear to be more appropriate to build on these earlier models incorporating this new information. However, some estimates of consumption have not considered changes in energy requirements with reproduction, season or activity (Olesiuk, 1993; Hammill et al., 1995; Stenson et al., 1995; Mohn and Bowen, 1996), arguing that such models require the estimation of a large number of parameters for which the data are limited (Mohn and Bowen, 1996), and much of the increased costs associated with reproduction are cancelled out by the reduction in energy requirements during moult (Ryg and Øritsland, 1991).
There is a need to examine whether energy requirements should be modelled in detail or whether this step can be replaced by a simplified energy model because the uncertainty associated with energy requirement estimates has a major impact on final estimates of consumption (Mohn and Bowen, 1996; Shelton et al., 1997). Also, interest in pinniped consumption has moved from a general global scale such as the northwest Atlantic (Lavigne et al., 1985 ; Bowen, 1985) to a smaller more restricted geographical scale such as the southern Gulf of St Lawrence (Hammill and Stenson, 2000; Chouinard et al., 2005), where seasonal changes in energy requirements may be more important.
Here we model seasonal changes in gross energy intake (GEI), the amount of energy that must be consumed by a pinniped, the northwest Atlantic harp seal, and compare these estimates with output from a more simple, constant intake model.
Model Formulation
The model estimates the GEI of a population of harp seals by multiplying the estimated GEI of individual animals by the estimated numbers of animals in each age, sex and reproductive class. In our simulations, we used the estimated number of harp seals at age, in 1968 and in 2005 (Hammill and Stenson, 2008).
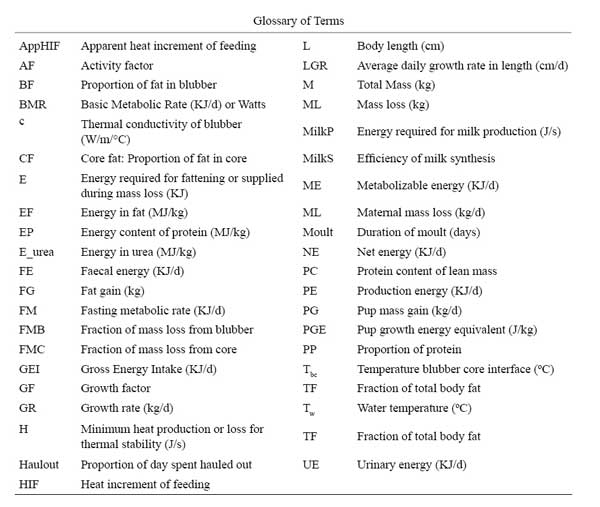
The year begins in the model (Zeroday) on the 1 March. The basic input parameters are age and sex (male, non fertile females, fertile females, and pups). GEI for maintenance and growth of an individual animal incorporating daily changes in composition are calculated and summed over five periods: breeding, premoult, moult, buildup and winter (Table 1). The corresponding periods for pups are suckling, postweaning fast, early growth, buildup and winter. We assumed that harp seals were in southern waters along the Labrador coast (NAFO fishing zone 2J) from the 15 November to the 15 June and in the Arctic during the rest of the year (Fig. 1) (Hammill and Stenson 2000). The seasonal changes in total body mass, sculp (blubber and attached skin) and core (carcass and viscera) masses were adjusted to fit morphometric data from a sample of over 8 800 harp seals collected from the Gulf of St. Lawrence, Newfoundland and Labrador (Hammill et al., 1995; Chabot et al., 1996). The model was implemented as an Excel spreadsheet which allowed for an easy accounting of energy requirements.
The sensitivity of the model to different components was examined by independently changing model parameters by 10%. The impact of these changes on annual GEI was expressed in relative terms using:
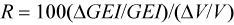
where GEI is the Gross Energy Intake in kj/d, and V is the variable as modified by Mohn and Bowen (1996).
GEI estimates from the complex model were compared to those obtained using a simple model of the form:
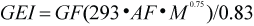
where GF is the growth factor and was set at 1.8, 1.6, 1.4, 1.3, 1.12, 1.1, and 1.0, for animals aged 0, 1, 2, 3, 4, 5, and 6 yrs, respectively (Olesiuk, 1993), and M is body mass in kg. The activity factor (AF) was assumed to be 2 (Worthy, 1990) to approximate the average daily energy requirements as a multiple of the basal metabolic rate (293•M0.75; Kleiber, 1975) where M is body mass-at-age in kg.
Model Development
Using an equation, modified after Lavigne et al. (1982), the energy flow in an individual can be summarized as:

where Gross Energy Intake (GEI) is energy ingested as food. Losses occur as faeces (Faecal Energy, FE), through urine production (UE) and the Heat Increment of Feeding (HIF). Fasting metabolic rate (FM) is the energy available for maintenance of body functions (basal metabolism, thermoregulation), while production energy (PE) is used for growth and reproduction and for doing work.
Fasting Metabolic Rate
Fasting metabolic rate (FM) is calculated as the highest value (Max) of either the sum of basal energy requirements (BMR) plus the cost of activity or the minimal heat production for thermal stability (H) and is calculated for the proportion of the time that the animal spends hauled out on the ice (Haulout) and in the water (1-Haulout) using equation (2).

Metabolic costs in J/s (or Watts) were estimated using:
Energy = AF • BMR
where the basal metabolic rate (BMR) was estimated from BMR (W) = 3.39 Mass0.75 (Kleiber, 1975; Gallivan and Ronald, 1979; Lavigne et al., 1985, 1986) and AF is a factor for the cost of activity expressed as a multiple of the basal metabolic rate (Table 1). The activity budget was determined for three periods: Breeding season (which included suckling and the post-weaning fast for pups), Moult, and Other (for the remainder of the year). Behavioural categories were hauled-out, resting in the water; cruising which represents travel between specific areas and searching for short trips associated with foraging (Table 2).
The cost of each behavioural category is given as a multiple of BMR, called the Activity Factor (AF). These activity factors were combined with the amount of time spent in each activity to give an activity factor to be applied to the basic equation estimating BMR. For example AFwater was estimated using equation (3),

where Rest is when the animal is stationary, cruise is medium swimming e.g. during migration, and search is active swimming and diving to search for food. Heat loss was calculated separately for animals in the water or hauled out on the ice. The minimum heat loss for thermal balance in water, Hmin (J/s), was estimated by using equation (4),

where c is the thermal conductivity of the blubber (0.185 W/m/ºC; Worthy, MS 1985; Ryg et al., 1993); L is the body length on the 1 March, LGR is the average daily growth rate in length (cm/d), Tbc is the temperature at the interface between blubber and core and is assumed to be constant (30ºC; Ryg and Øritsland, 1991; Ryg et al., 1993); and Tw is the water temperature. M and Mcore are body mass and core mass respectively (kg). The first term accounts for the heat loss from the body trunk (Ryg et al., 1988), while the second term calculates the heat loss from the appendages from 1.18 + 0.0006 Tw (Ryg et al., 1993); 0.023 Mtot0.49 is the relationship between total appendage area, as an average of spread and folded flippers, and body mass; and the surface area of the body trunk is given by the denominator. To estimate heat loss on ice, HIce (J/s), Tw was replaced by the skin temperature, calculated as a regression on air temperature, Tair, from Hart and Irving (1959)’s data:
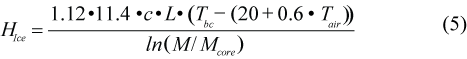
where 1.12 is the correction for heat loss from flippers, assuming that the flipper surface area of harp seals is a similar proportion to that of grey seal (0.12) (M. Ryg, unpublished), and that heat loss per unit surface area is the same as for the body. Maximum water temperatures were set at 15°C in the Gulf and 5°C in the Arctic, whereas the minimum water temperatures were set at -1°C in the Gulf and -2°C in the Arctic. Maximum air temperature was set at 18°C in the Gulf and 8°C in the Arctic, while minimum air temperature was set at -15°C in both the Gulf and the Arctic. We assumed that the highest temperatures were reached in air on 15 July and in water on 1 August for both areas. Sinusoidal equations were used to describe seasonal variations in air and water temperatures during the year (M. Ryg, unpublished data).
Body length (cm) and body mass (kg) are calculated as a Gompertz growth curve (Hammill et al., 1995):
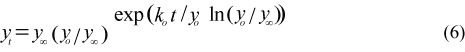
where yt is the length (Lt, cm) or mass (Mt, kg) at age t, y∞ is the asymptotic length (L∞) or mass (M∞), is the ordinate or the estimated absolute length (Lo) or mass (Mo) at birth which has been set at on 1 March, and ko is the slope at zero abscissa or the estimated absolute growth rate at birth (cm/year or kg/year). The Gompertz curve was fitted to January–February body mass (N = 537) data when animals are fattest and to body length (N = 550) data from harp seals collected at the Front (Table 3; Chabot et al., 1996). The proportion of maximum sculp mass (Msculp) to body mass was set at 0.5 for breeding females, immatures and pups, and 45% for nonbreeding females and adult males. The core mass (Mcore) on 1 March was calculated by M (1-Msculp). The daily variations in the percentage of sculp mass on body mass were then indirectly calculated by the changes in the percent of core mass on total body mass.
In pups, the model uses actual body mass (M) and length (L) measurements obtained at birth (N = 68; Chabot et al., 1996). M was set at 9.3 kg, and L at 0.86 m for both sexes.
Production
Net energy (NE) for production was subdivided into energy required for growth, fattening, fetal growth, and milk production. To meet these demands harp seals use energy reserves during lactation and moult, and rebuild reserves at other periods in the year. The energy for milk production is used by the pup for energy deposition and energy expenditure but is attributed to the female in the estimates of GEI for the population.
The growth rate (GR, kg/day) and the average daily length growth rate (LGR, cm/day) were calculated as the difference between the body mass (M) or body length (L) at the age t and the body mass (Mnext) or body length (Lnext) at the age t + 1, divided by 365 days for adults, and 365 minus the date of birth (Startlac) which is 1 March for pups.
The energy (E) required for growth and fattening or energy supplied by mass loss during the breeding (suckling), premoult (weaned), moult (early growth), and build up periods were calculated using equation (7)

where Msculp is mass of the blubber plus the skin (kg), Mskin is skin mass (kg), BFn is the proportion of fat in the blubber at period n, EF is energy in fat (MJ/kg), CFn and Mcoren are, respectively, the proportion of fat in core and the core mass (kg) at the beginning (1) and the end (2) of the corresponding period (seconds). PP is the proportion of protein and EP is the energy content of protein (MJ/kg). For pups, skin mass is calculated as the proportion skin mass at weaning times the mass at weaning (Worthy and Lavigne, 1987). For older animals, skin mass is given by the regression 0.3379(M•L)0.5 + 1.7761 for females and 0.4855 (M•L)0.5 + 0.1558 for males (M. Hammill, unpublished data).
Changes in body mass were converted into energy expenditure assuming an energy content of 39.5 MJ/kg for lipid (EF) and 23 MJ/kg for protein (EP) (Worthy and Lavigne, 1983b; Reilly and Fedak, 1990) with a correction for urea excretion (E_urea) of 5 MJ/kg.
Fasting
The energy used during fasting is derived from blubber, and from carcass proteins and fat deposits. The fraction of the total mass loss from the blubber (FMB) and from the core (FMC) during fasting vary with age and species (Worthy and Lavigne, 1987; Markussen et al., 1992; Slip et al., 1992; Walker and Bowen, 1993). In all groups, the proportion of protein in the core (PC) was set at 0.23 (Blaxter, 1989; Reilly and Fedak, 1990). The proportion of fat in the blubber in immatures and adult males was set at 0.97 for all periods (Beck et al., 1993).
Reproduction
Females first give birth at age 6 y, (Sjare et al., 1996), males are assumed to be fertile at the age of 7 y (Benjaminsen and Øritsland, MS 1975; Roff and Bowen, 1986). Adults reduce their food intake during breeding. For females this reduced intake lasts for the 13 day lactation period (Kovacs et al., 1991; Lydersen and Kovacs, 1996; Oftedal et al., 1996). Females lost mass (ML) at a constant rate (Kovacs et al., 1991; ¯x = 3.1 ± 0.8 kg; N = 19). Sixty percent of the total mass loss occurred from the blubber (Chabot et al., 1996) with the fat content of the blubber declining from 0.99 at the beginning of lactation (Frank et al., 1973), to 0.75 at the end (Ronald et al., 1984). The remaining mass loss occurred from core fat and proteins. The proportion of fat in the core was 0.05 before breeding (Beck et al., 1993) declining to 0.02 after breeding (Gales et al., 1994).
Lactation
Energy requirements for milk production (MilkP in J/s) were calculated as the sum of the female changes in energy stores, and maintenance and growth energy requirements of the pup using equation (8),

where MML is the maternal body mass loss of 3.1 kg/d associated with the pup mass gain (PG) (Kovacs et al., 1991); PGE is the pup growth energy equivalent (J/kg; see below); 86 400 is the number of seconds in a day; Day is the number of days since pupping on 1 March; MilkS is the efficiency of milk synthesis, arbitrarily set at 90%; ME/GE milk is the efficiency of converting milk energy to metabolisable energy, set at 85% (grey seals: Anderson and Fedak, 1987); PupAF_Lac is the activity factor multiple of BMR for the pup during the nursing period (3.9; Lydersen and Kovacs, 1996). We calculated a pup growth energy equivalent of 2.3×10⁷ J/kg using:

given a proportion of fat in the pup mass gain (FG) of 0.54 , reported by Lydersen and Kovacs (1996) for harp seal pups using labelled water techniques.
Pups gain 2.3 kg/d (PG) during suckling (Oftedal et al., 1989; Kovacs et al., 1991; Lydersen and Kovacs, 1993; Oftedal et al., 1996). At birth, the proportion of fat in the blubber is 0.21 (BFb), which forms 6% of body mass (Mb) (Bailey et al., 1980; Worthy and Lavigne, 1983a; Oftedal et al., 1996). The blubber increases to 47% of body mass (Blubw) (Worthy and Lavigne, 1983a; Oftedal et al., 1996) with a fat content of 89% at weaning (BFw) (Worthy and Lavigne, 1983a).
A core mass gain of 0.81 kg/day was calculated for the pup during the 13 day lactation period (Lac). This gain in core mass constitutes 35% of the total gain during the suckling, which is similar to the value reported by Oftedal et al. (1989) for six suckling harp seals. During suckling the proportion of fat in the core increases from 0.023 at birth (CFb), to 0.125 at weaning (CFw) and then declines to 0.09 after the postweaning fast (CFpw) (Worthy and Lavigne, 1983b) and increases to an arbitrarily set value of 0.10 after initial growth (Worthy and Lavigne, 1983a).
Adult males
Little information is available concerning males during the breeding period. They appear to begin losing mass in early March, (Chabot et al., 1996; Chabot and Stenson, 2002). We assumed males lost mass at a rate of 0.6% per day (Chabot and Stenson, 2002; 0.8% per day in harbor seals: Walker and Bowen, 1993; 0.9% per day in grey seals: Deutsch et al., 1990 calculated from Anderson and Fedak, 1985) and that the total loss over the breeding season was 15% of their initial body mass, which is similar to males in other species (17–25% in grey seals: Deutsch et al., 1990; 7.7–26% in grey seals: Tinker et al., 1995; 20–30% in harbor seals : Walker and Bowen, 1993). This resulted in mass loss rates of 0.96 to 1.13 kg/day and a fasting duration of 21 days (1–21 March). Much of the mass loss occurred from the core (60%) (Fig. 2a) (Chabot et al., 1996; Chabot and Stenson, 2002)., 2002).
Premoult or postweaning fast
Adult females feed intensively between the end of breeding and moult (Sergeant, 1991). We calculated that females gained 0.5 kg/day during a premoult period of 33 days, assuming a recovery of 64% of the total body mass lost during breeding (Fig. 2b) (Beck et al., 1993; Chabot et al., 1996). The rate of core mass gain for fertile females during premoult was calculated by multiplying the rate of mass gain during premoult by the fraction of core mass on total body mass at the end of breeding.
There is no evidence of fattening in adult males before moult, but some feeding may occur (Sergeant, 1991). We assumed that adult males lost 15% of their body mass at the end of the breeding season during a premoult period of 12 days. This corresponds to a rate of mass loss of 33% of that during breeding. For males, mass loss during breeding and premoult agree well with Chabot and Stenson’s (2002) finding of a total mass loss of about 40 kg or 27% of peak mass in adult males between late February and late April.
In immature and non-breeding animals the premoult period starts at the end of the winter period (4 March). No change in the body mass occurs in immature animals during the winter period (January–March) (Chabot et al., 1996). For nonbreeding adult females, the rate of mass loss was calculated assuming a loss of 20% of the mass at the end of the winter period, divided by the number of days of the premoult period. The rate of core mass loss during premoult was given by the rate of mass loss multiplied by the fraction of total mass loss from the core (FMC).
The premoult period in adults corresponds to the postweaning fast in the pups. The durations of the post-weaning fast varies from 4–6 weeks (Worthy and Lavigne, 1983a, b; Lavigne et al., 1985; Worthy, 1987a, b; Worthy and Lavigne, 1987; Bowen, 1991). We assumed a duration of five weeks (Lavigne et al., 1985) and a mean body mass loss of 0.36 kg /day (Nordøy et al., 1993), resulting in a rate of core mass loss of 0.2 kg/day. Because of the higher contribution of core mass in the total mass loss, the percent of sculp mass on body mass continues to increase after weaning until it reaches ≈60% of body mass at the end of the postweaning period (pups aged 48 days).
Moult or early growth
Males and juvenile harp seals begin their moult simultaneously in early April while females arrive on moulting patches in late April (Sergeant, 1991). We set the beginning of the moult to 7 April for males and immatures, and to 18 April for mature females with a duration of five weeks for all groups. The effect of moulting on metabolic rate of phocids is not well understood. Decreases in resting metabolic rate during moult have been reported in harbor and spotted seals (19%; Ashwell-Erickson et al., 1986), and in elephant seals (18%; Slip et al., 1992; Worthy et al., 1992), whereas increases in resting metabolic rate have been measured in southern elephant seals (40%; Boyd et al., 1993), harp (Renouf and Gales, 1994) and grey (adults: 17% adults; juveniles: 53%; Boily, MS 1995) seals. We assumed a decrease in BMR of 19% below the premoult level for both adults and juveniles, corresponding to an activity factor of 1.6. The percent of body mass loss during the moult was calculated from Chabot et al. (1996) to be -0.8% per day in juvenile females and adult males, -1.0% per day in juvenile males, and -0.8% per day in all adult females (breeding and nonbreeding). The rate of core mass loss during the moulting period was given by the rate of mass loss multiplied by the fraction of total mass loss from the core (FMC).
For pups, this phase of early growth is when they develop their swimming and feeding skills. Feeding occurs irregularly and growth rates may be low or even negative (Worthy, MS 1985; Worthy, 1987a, b; Sergeant, 1991). Feeding begins within six weeks of weaning in wild harp seal pups (Worthy and Lavigne, 1982). We assumed that pups did not lose or gain any mass during the first four weeks after the postweaning fast ended (21 April–18 May), based on the body mass of 40–70 day old pups (N = 359 for females; N = 423 for males) from the Front (Fig. 2) (Chabot et al., 1996).
Buildup
The buildup period corresponds to a period of extensive feeding in all animals, extending from the end of the moult to the beginning of the winter period. In adult females implantation occurs and these animals must also support the growth of the fetus. The growth rate for all animals during this period (GRbuildup, kg/d) was calculated by using equation (10).

The first parenthesis calculates the body mass (M) at the end of the buildup period, giving Monext, the body mass at the next breeding season; GRwinter, the growth rate during the winter period (kg/day). The second parenthesis calculates the body mass at the end of the moult, giving Mbefmoult, the body mass before moult; Mass Loss (ML), the rate of mass loss during moult (kg/day); and Moult, the duration of the moult (days). The body mass after buildup minus the body mass after moult is then divided by the duration of the buildup period, Fattest, being the last day of the buildup period, and Endmoult, the last day of the moult. The rate of core mass gain was calculated by the difference between the core mass after buildup and the core mass after moult (early growth for pups), divided by the duration of the buildup period.
Pregnancy
Implantation of the embryo in harp seals take place 143 to 153 days after conception (Stewart et al., 1989; Chabot and Stenson, 2000). Assuming conception occurs around weaning, we set the implantation date (Implant) at 11 August (Chabot and Stenson, 2000). Daily energy requirements (kJ/d) of the foetus and other tissue could be approximated by twice Kleiber’s (1975) weight specific basal metabolic rate of the foetus (Lavigne et al., 1982) and adding in the daily energy gain. We used mass at birth as part of the Kleiber formula and 1.1 was a slight correction to account for the mass of the placenta:
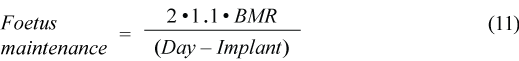
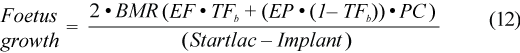
where EF is energy of fat, TFb is the percent of total body fat at birth (in blubber, carcass and viscera) set at 3.6% (calculated by Oftedal et al., 1996 as 3%), EP is energy of protein, and PC is the protein content of lean mass.
Winter
The winter period corresponds to a period between the buildup phase (31 January) and the beginning of the breeding season (5 March). During this period, the seals continue to put on mass but at a lower rate than during the buildup period. Growth rates were assumed to be 60% of the annual growth rate (GRannual) for juveniles and adults, and 20% of the annual growth rate for pups. The rate of core mass gain was calculated by:
GRwinter • (1 − Sculpnext)
where Sculpnext is the percent of sculp mass on body mass at the beginning of the next breeding season.
Heat Increment of Feeding
The heat increment of feeding (HIF) is a fraction of metabolizable energy (ME), set at 20% (Lavigne et al., 1985). Net energy (NetE) is the difference between HIF and ME. If the animal is below its thermoneutral zone, HIF can be used to maintain body temperature (Worthy, 1990). To avoid counting energy twice, an “apparent” heat increment of feeding (AppHIF) was calculated as the heat increment of feeding (HIF) minus the difference between the minimum heat production for thermal stability and the sum of BMR and activity using equation (13).
Gross Energy Intake
The efficiency of assimilation increases with the caloric density of the prey, varying from about 81–83% for a diet of shrimps only to 93–94% for a diet of capelin (Mårtensson et al., 1994). We assumed a metabolizable energy of 82.7% of gross energy intake (ME/GEI), according to Lavigne et al. (1982, 1985) for an average fish meal.
The annual metabolizable energy requirements (MEannual) were calculated as the sum of daily values of ME over the year. GEI was then calculated as:

Conclusions
There are important differences between males and females in the pattern of mass change (Fig. 2). Mature males lose mass throughout the spring from the beginning of the breeding season in early March and continuing until May, after the moult. This loss occurs primarily in the sculp. By late May, males begin to regain mass, and continue this mass gain throughout the year until late January. From late January until early March there is little mass change. Among breeding females, there is significant mass loss during lactation. After lactation, females regain about 64% of this mass loss during March and April, then undergo a further decline in mass during the moult. Again much of this mass loss occurs primarily in the sculp. Mass gain begins again in late May and continues throughout the spring and autumn until late January (Fig. 2).
Marked seasonal changes in GEI were observed owing to the contrasting demands of reduced intake during breeding and moult and the buildup of energy reserves during other periods in the year (Table 4). Among adult males the greatest GEI intake occurs during the fourth quarter, when animals are moving south along the Labrador coast into the Gulf of St Lawrence (Fig.1). Lower GEI is seen during the first and second quarter, when breeding, moulting and the beginning of the return migration to the north occur. GEI increased again during the third quarter when animals are in the Arctic. Among breeding females, GEI was greatest during the fourth quarter, and as in adult males began to decline during the first quarter (Fig. 3; Table 4). However, the decline in GEI during this quarter was not as marked in whelping females, declining by about 14% compared to the 30% reduction in GEI observed among adult males. These differences reflect the feeding activity of females during and immediately after lactation, when they replace some energy reserves. As in adult males GEI by breeding females continued to decline reaching a minimum during the second quarter of approximately 50% of the fourth quarter levels. Among non-breeding animals aged 1+ y, GEI also reached a maximum during the fourth quarter, and then declined slowly during the first quarter reaching a minimum during the second quarter (Table 4). Among pups independent feeding begins in the second quarter after the post-weaning fast (Table 4). GEI increases throughout the year and then appears to decline during the first quarter. However, this decrease results from an accounting difficulty since animals are suckling during their first March and have moved into a different age class by their second March.
Estimates of GEI were most sensitive to changes in the fraction of the gross energy available as metabolizable energy, the activity factor and estimates of body mass (Table 5). Changes in the conductivity of blubber, fat content of the blubber and the fraction of the total mass that was composed of the blubber and skin (sculp) had intermediate effects on estimates of total energy requirements. Including the effects of reproduction increased the female’s annual GEI by about 10% compared to a male harp seal of the same age and by 15% compared to a non-breeding female of the same age. Variability in water or air temperature, and changes in activity budget had little effect on estimates of GEI.
GEI using a simple model were estimated using Mmax, the seasonal maximum body mass (kg), or Mmin , which is body mass from April when mass approaches its annual minimum (Fig. 2; Table 4). The resulting estimates of annual GEI using the Mmax form of the constant model with no seasonal changes in GEI overestimates annual consumption among adult males by ≈6% compared to the detailed seasonal model (Table 4), while using Mmin underestimates estimated energy requirements by ≈27%. However, seasonal comparisons illustrate more significant differences with the simple model overestimating energy intake by 23% and 65% for the first and second quarters respectively, while underestimating consumption by 11% and 17% in the third and fourth quarters respectively (Table 4). However, harp seals feed very little during the breeding season and during the moult. If this is taken into consideration by setting GEI to zero during these two periods, then consumption would be overestimated by 21% during the first quarter, would essentially be the same as predicted by the detailed model for the second quarter, but would underestimate consumption by 10% and 16% during the third and fourth quarters respectively (Table 4). For adult females, a simple model based on the maximum mass (not including the foetus), would underestimate annual GEI by about 10% compared to the detailed model, while a simple model using the minimum seasonal mass would underestimate GEI by about 38% (Table 4). Taking into account that females do not feed during lactation and the moult, this adjusted version of the simple maximum mass model would underestimate GEI by 21% overall. The adjusted simple model would also underestimate GEI during all quarters, with the exception of the second quarter, where GEI would be similar (Table 4). For a 3 year old male, the simple model using Mmax, which occurs just prior to the animal turning 4, would underestimate GEI by about 16%, overall, but would underestimate intake by 19%, 25% and 30% during the first, third and fourth quarters respectively. If a growth factor of 1.3 is included in the basic equation (Hammill and Stenson, 2000), and taking into account that animals do not feed during the moult, then GEI is underestimated by 2% compared to the detailed model. Seasonally, intake would be overestimated by 6%, and 3%, in the first and second quarter, respectively, but underestimated by 3%, and 9% during quarters 3 and 4 (Table 4). In pups, large discrepancies are seen between annual GEI estimated from the seasonally varying model and the constant models depending on whether mass at birth or mass at weaning is used. If a mass of a male pup at the end of the post-weaning fast (26.6 kg) is used, then the annual GEI of a pup would be 3 018.4 MJ/y, which is 33% lower than the 4 550.5 MJ/y predicted by the detailed model. However, if the same mass is used, and a growth factor of 1.8 is incorporated into the basic equation (Hammill and Stenson, 2000), then the simple model would overestimate annual GEI (consumption) by 8% and seasonally would overestimate consumption by 7 to 33% for the first three quarters, but would underestimate GEI by 6% in the fourth quarter (Table 4).
Discussion
Our objective was to model seasonal changes in GEI of harp seals and to assess how this might affect estimates of GEI at the population level. We assumed that an average harp seal was able to obtain the energy needed to satisfy its daily energy requirements, consequently feedback loops were not incorporated to examine changes in metabolic rates such as metabolic depression (Øritsland and Markussen, 1990) or changes in body composition that would occur if energy requirements could not be met (Worthy, 1987b).
The model was very sensitive to changes in body mass, the activity factors used to model the energetic cost of various activities, and the estimate of metabolizable energy as a fraction of gross energy. Estimates of conductivity and the fat content of the blubber were of lesser importance while changes in ambient temperature had little impact on annual GEI estimates. Changes in the activity budget also had little impact on estimates of GEI, but this factor is linked very closely to the activity factors applied to estimate daily energy expenditures. The model estimated the cost of gestation as 587 MJ, which is similar to the costs associated with gestation in the slightly larger grey seal (675 MJ) (Yunker et al., 2005). Reproduction increased estimated female annual GEI by 15%, which is similar to the value of 14.6% estimated by Olesiuk (1993) for harbour seals. We also modelled minimal heat loss using the approach described by Ryg et al. (1988), (Equations 4 and 5), but it has been argued that true heat loss might only be 60% of the values estimated from Equations 4 and 5 (Kvadsheim et al., 1997). However, if just adult and juvenile males are considered, adjusting the heat loss equations would have minimal impact on estimates of energy consumption, reducing energy intake by 4–5% respectively.
The development of a detailed model provides insights into the array of principles and mechanisms constraining the individual (Øritsland and Markussen, 1990), at the same time it also serves to underline gaps in our knowledge. Seasonal changes in energy requirements of harp seals have been modelled elsewhere (Lavigne et al., 1982; Øritsland and Markussen, 1990), but since the development of these models our information on several aspects of harp seal biology have improved considerably (e.g. Kovacs et al., 1991; Lydersen and Kovacs, 1993, 1996; Beck et al., 1993; Hammill et al., 1995; Chabot et al., 1996; Oftedal et al., 1996; Chabot and Stenson, 2002). In spite of this progress and the extensive data base on Northwest Atlantic harp seals (Chabot et al., 1996), better information is still required on changes in body mass and body composition of mature, non-breeding females and in particular on mass changes in males between May and November. Samples obtained from the autumn migration (November) show that there has been little mass gain since the early April to mid-May moult, the previous spring, but it is unclear whether there is little mass gain, during the summer, or additional mass loss occurs during the autumn migration from the Arctic to the coastal waters off the Labrador coast and into the Gulf of St. Lawrence (Chabot and Stenson, 2002). Animals begin gaining mass after arrival in southern waters, reaching a peak just prior to pupping in March. This contrasts markedly with northeast Atlantic harp seals that begin to gain mass after the moult and continue throughout the summer and fall. Northeast Atlantic harp seals appear to reach a peak in mass in October, then lose mass slightly through the winter until pupping in March, when rapid mass loss occurs (Nilssen et al., 2000). Significant gaps also remain in information on activity budgets, and cost of diving, although some information is available for other species (e.g. Sparling and Fedak, 2004). Considerably more work is needed to improve our understanding of the duration of the moult, and the effects of the moult on metabolic rate. Several authors have reported that metabolic rate declined during the period when the moult would occur (Ashwell-Erickson et al., 1986; Slip et al., 1992; Worthy et al., 1992; Sparling et al., 2006), while others have found that metabolic rate increased (Boyd et al., 1993; Renouf and Gales, 1994; Boily, MS 1995).
Estimates of GEI from the detailed model were similar to those reported elsewhere for harp seals. Lager et al. (1994) estimated that juvenile harp seals (age 2–4 years old) required on average 25 600 KJ/d in captivity. This is slightly higher (14%) than the 22,100 KJ/d we estimated for a three year old juvenile, but compares favourably to the 24 200 KJ/d that the model would estimate for a four year old juvenile. Applying the model to estimates of age composition of the northwest Atlantic harp seal population in 1968 and 2005, when the population increased from 2 million to 6 million animals and there was a marked change in productivity of the herd (Table 6) (Hammill and Stenson, 2008), results in an increase in annual energy requirements from 17.3×10⁹ to 49.6×10⁹ MJ. Although there was a reduction in productivity of the herd, with adult reproductive rates declining from 0.87 to 0.71, the proportion of juveniles (age 1–5) in the herd increased from approximately 29% to 34%. Consequently, overall there was no change in per capita energy consumption with a per capita consumption of 8.3×10³ MJ/y (Tables 6 and 7). These estimates of per capita energy consumption are similar to values of 9.3×10³ MJ/y estimated by Nordøy et al. (1995) when his population estimate is converted to per capita consumption, and our estimates are approximately 17–26% lower than estimates of 10.0–11.2×10³ MJ per capita per year in earlier models (Lavigne et al., 1982; Øritsland and Markussen, 1990). Under most conditions, energy requirements determined from the basic Kleiber equation for BMR as a function of body mass and the scalar multipliers developed to account for activity were very similar to the GEI of harp seals obtained from the detailed model. Consequently, the simplified model, taking into account age specific growth factors would appear to provide a reasonable approximation of annual GEI for a phocid such as the harp seal. The resulting estimates are likely conservative, but the uncertainty in these estimates are less important than the uncertainty associated with total population size, distribution and the very large uncertainty associated with diet composition (Hammill et al., 1995; Shelton et al., 1997). However, a simplified model might significantly underestimate or overestimate seasonal energy requirements which could be an important factor when trying to determine consumption in a particular region or at a particular time of the year. Seasonal changes in energy intake could be taken into account by setting intake to zero during reproduction and the moult and possibly improved further by including annual changes in body mass (Trzinski et al., 2006).
Some of the harp seal population remains in Arctic regions year-round, while approximately 80% are considered to migrate south to southern Labrador and into the Gulf of St. Lawrence beginning in mid-November and remain in southern waters until about mid-June (Hammill and Stenson, 2000). During that period marked changes in energy intake occur. Taking into account the seasonal distribution shifts and changes in energy requirements, only about 40% of the annual intake by Northwest Atlantic harp seals would occur in southern waters. Thus, failure to take into account seasonal changes could have a significant impact on our views of consumption by these animals.
Estimating GEI by seals is a complex issue requiring the estimation of many parameters. The complex model indicated that changes in body mass and the activity factors had a major impact on estimates of energy requirements. Overall the simple model with a constant energy intake provides a reasonable estimate of annual energy requirements. However, pinnipeds do undergo marked seasonal changes in energy intake, which could have important implications if GEI is being considered within a limited time frame or a specific area. This can be accommodated in a simple model by taking into consideration seasonal changes in mass and seasons when animals are not feeding.
References
ANDERSON, S. S., and M. A. FEDAK. 1985. Grey seal males: energetic and behavioural links between size and sexual success. Anim. Behav., 33: 829–838. doi:10.1016/S0003–3472(85)80017–8
1987. Grey seal energetics: females invest more in male offspring. J. Zool., 211: 667–679.
ASHWELL-ERICKSON, S., F. H. FAY, R. ELSNER, and D. WARTZOK. 1986. Metabolic and hormonal correlates of molting and regeneration of pelage in Alaskan harbor and spotted seals (Phoca vitulina and Phoca largha). Can. J. Zool., 64: 1086–1094. doi:10.1139/z86–163
BAX, N. J. 1999. The significance and prediction of predation in marine fisheries. ICES J. Mar. Sci., 55: 997–1030. doi:10.1006/jmsc.1998.0350
BAILEY, B. A., R. G. H. DOWNER, and D. M. LAVIGNE. 1980. Neonatal changes in tissue levels of carbohydrate and lipid in the harp seal Pagophilus groenlandicus. Comp. Biochem. Physiol., 67B: 179–182.
BECK, G. G., T. G. SMITH, and M. O. HAMMILL. 1993. Evaluation of body condition in the Northwest Atlantic harp seal (Phoca groenlandica). Can. J. Fish. Aquat. Sci., 50: 1372–1381. doi:10.1139/f93–157
BENJAMINSEN, T., and T. ØRITSLAND. MS 1975. The survival of year-classes and estimates of production and sustainable yield of northwest Atlantic harp seals. ICNAF Res. Doc., No. 121, Serial No. 3625, 17 p.
BLAXTER, K. 1989. Energy metabolism in animals and man. Cambridge University Press, Cambridge.
BOILY, P. MS 1995. Partitioning variation in resting metabolic rates of captive female grey seals (Halichoerus grypus). M.Sc. Thesis, University of Guelph, Ontario.
BOWEN, W. D. 1985. Harp seal feeding and interactions with commercial fisheries in the north-west Atlantic. In: Marine Mammals and Fisheries. J. R. Beddington, R. J. H. Beverton, and D. M. Lavigne (eds.). George Allen and Unwin, London. p. 135–149
1991. Behavioural ecology of pinniped neonates. In: Behaviour of pinnipeds. D. Renouf (ed.). Chapman & Hall, New York. p. 66-127
1997. Role of marine mammals in aquatic ecosystems. Mar. Ecol. Prog. Ser., 158: 267–274. doi:10.3354/meps158267
BOYD, I. L., T. A. ARNBOM, and M. A. FEDAK. 1993. Water flux, body composition, and metabolic rate during molt in female southern elephant seals (Mirounga leonina). Physiol. Zool., 66: 43–60.
CHABOT, D., and G. B. STENSON. 2000. Implantation date, growth rate, and allometric relationships in foetal Northwest Atlantic harp seals (Phoca groenlandica). Can. J. Zool., 78: 501–505.
CHABOT, D., and G. B. STENSON. 2002. Growth and seasonal fluctuations in size and condition of male Northwest Atlantic harp seals Phoca groenlandica: an analysis using sequential growth curves. Mar. Ecol. Prog. Ser., 227: 25–42. doi:10.3354/meps227025
CHABOT, D., G. B. STENSON, and N. G. CADIGAN. 1996. Short and long-term fluctuations in the size and condition of harp seal (Phoca groenlandica) in the Northwest Atlantic. Joint ICES/NAFO Working Group on Harp and Hooded Seals, Dartmouth, NS, 5–9 June 1995. NAFO Sci. Coun. Studies, 26: 15–32.
CHASSOT, E., D. DUPLISEA, M. O. HAMMILL, A. CASKENETTE, N. BOUSQUET, Y. LAMBERT, and G. STENSON. 2009. The role of predation by harp seals (Pagophilus groenlandicus) in the collapse and non-recovery of northern Gulf of St. Lawrence cod (Gadus morhua). Mar. Ecol. Prog. Ser., 379: 279–297. doi:10.3354/meps07897
CHOUINARD, G. A., D. P. SWAIN, M. O. HAMMILL, and G. A. POIRIER. 2005. Correspondence between changes in grey seal population abundance and variation in natural mortality of southern Gulf of St. Lawrence cod. Can. J. Fish. Aquat. Sci., 62: 1991-2000. doi:10.1139/f05–107
DAVIS, R. W., T. M. WILLIAMS, and G. L. KOOYMAN. 1985. Swimming metabolism of yearling and adult harbor seals Phoca vitulina. Physiol. Zool., 58: 590–596.
DEUTSCH, C., M. P. HALEY, and B. J. LE BOEUF. 1990. Reproductive effort of male northern elephant seals: estimates from mass loss. Can J. Zool., 68: 2580–2593. doi:10.1139/z90–360
FRANK, R., K. RONALD, and H. E. BRAUN. 1973. Organochlorine residues in harp seals (Pagophilus groenlandicus) caught in eastern Canadian waters. J. Fish. Res. Board Can., 30: 1053–1063.
FRCC. 1999. Conservation Requirements for the Gulf of St Lawrence Groundfish Stocks and cod Stocks in Divisions 2GH and 3Ps. Fisheries Resource Conservation Council. Box 2001, Station D, Ottawa, ON. K1P 5W3. 46 p. + Appendices
GALES, R., D. RENOUF, and E. NOSEWORTHY. 1994. Body composition of harp seals. Can. J. Zool., 72: 545–551. doi:10.1139/z94–073
GALLIVAN, G. J., and K. RONALD. 1979. Temperature regulation in freely diving harp seals (Phoca groenlandica). Can. J. Zool., 57: 2256–2263. doi:10.1139/z79–293
HAMMILL, M. O., M. C. S. KINGSLEY, G. G. BECK, and T. G. SMITH. 1995a. Growth and condition in the Northwest Atlantic harp seal. Can. J. Fish. Aquat. Sci., 52: 478–488. doi:10.1139/f95–049
HAMMILL, M. O., and G. B. STENSON. 2000. Estimated prey consumption by harp seals (Phoca groenlandica), grey seals (Halichoerus grypus), Harbour seals (Phoca vitulina) and hooded seals (Cystophora cristata). J. Northw. Atl. Fish. Sci., 26: 1–23. doi:10.2960/J.v26.a1
MS 2008. Abundance of northwest Atlantic harp seals (1960 – 2008). Can. Sci. Advis. Sec. Res. Doc., 2008/77
HART, J. S. and L. IRVING. 1959. The energetics of harbour seals in air and in water with special consideration of seasonal changes. Can. J. Zool., 37: 442–457. doi:10.1139/z59-052
KVADSHEIM, P. H., A. R. L. GOTAAS, L. P. FOLKOW, and A. S. BLIX. 1997. An experimental validation of heat loss models for marine mammals. J. Theor. Biol., 184: 15–23. doi:10.1006/jtbi.1996.0256
KENNEY, R. D., G. P. SCOTT, T. J. THOMPSON, and H. E. WINN. 1997. Estimates of prey consumption and trophic impacts of cetaceans in the USA northeast continental shelf ecosystem. J. Northw. Atl. Fish. Sci., 22: 155–171. doi:10.2960/J.v22.a13
KLEIBER, M. 1975. The fire of life: An introduction to animal energetics, R.E. Krieger Publishing Company, Huntington, NY, 453 p.
KOVACS, K. M., D. M. LAVIGNE, and S. INNES. 1991. Mass transfer efficiency between harp seal (Phoca groenlandica) mothers and their pups during lactation. J. Zool., 223: 213–221. doi:10.1111/j.1469–7998.1991.tb04761.x
LAGER, A. R., E. NORDØY, and A. S. BLIX. 1994. Seasonal changes in food intake of harp seals (Phoca groenlandica) at 69°N . Mar. Mammal Sci., 10: 332–341. doi:10.1111/j.1748–7692.1994.tb00487.x
LAVIGNE, D. M, W. W. BARCHARD, S. INNES, and N. A. ØRITSLAND. 1982. Pinnipeds bioenergetics. In: Mammals in the Seas. Vol. IV. Small Cetaceans, Seals, Sirenians and Otters. FAO Fisheries Ser. 5, Rome, p. 191–235.
LAVIGNE, D. M., S. INNES, R. E. A. STEWART, and G. A. J. WORTHY. 1985. An annual energy budget for north-west Atlantic harp seals. In: Marine Mammals and Fisheries. J. R. Beddington, R. J. H. Beverton, and D. M. Lavigne (eds.). George Allen and Unwin, London. p. 319–336
LAVIGNE, D. M., S. INNES, G. A. J. WORTHY, K. M. KOVACS, O. J. SCHMITZ, and J. P. HICKIE. 1986. Metabolic rates of seals and whales. Can. J. Zool., 64: 279–284. doi:10.1139/z86–047
LYDERSEN, C., and K. KOVACS. 1993. Diving behaviour of lactating harp seal, Phoca groenlandica, females from the Gulf of St Lawrence, Canada. Anim. Behav., 46: 1213–1221. doi:10.1006/anbe.1993.1312
1996. Energetics of lactation in harp seals (Phoca groenlandica) from the Gulf of St. Lawrence, Canada. J. Comp. Physiol. B., 166: 295–304. doi:10.1007/BF02439915
MARKUSSEN, N. H., and N. A. ØRITSLAND. 1991. Food energy requirements of the harp seal (Phoca groenlandica) population in the Barents and White Seas. In: Proceedings of the Pro Mare Symposium on Polar Marine Ecology, Trondheim, 12–16 May 1990. E . Sakshaug, C. C. E. Hopkins, and N. A. Øritsland. (eds.). Polar Res., 10: 603–608.
MARKUSSEN, N. H., M. RYG, and N. A. ØRITSLAND.1992. Metabolic rate and body composition of harbour seals, Phoca vitulina, during starvation and refeeding. Can. J. Zool., 70: 220–224. doi:10.1139/z92–034
MÅRTENSSON, P.-E., NORDØY, E. S. and A. S. BLIX. 1994. Digestibility of crustaceans and capelin in harp seal (Phoca groenlandica). Mar. Mammal Sci., 10: 325–331. doi:10.1111/j.1748–7692.1994.tb00486.x
MOHN, R., and W. D. BOWEN. 1996. Grey seal predation on the eastern Scotian Shelf: modelling the impact on Atlantic cod. Can. J. Fish. Aquat. Sci., 53: 2722–2738. doi:10.1139/cjfas–53–12–2722
MORISSETTE, L., M. CASTONGUAY, C. SAVENKOFF, D. P. SWAIN, D. CHABOT, H. BOURDAGES, M. O. HAMMILL, and J. M. HANSON. 2008. Contrasting changes between the northern and southern Gulf of St. Lawrence ecosystems associated with the collapse of groundfish stocks. Econorth Proceedings in DSRII. Deep–Sea Res. pt. II, 56: 2117–2131. doi:10.1016/j.dsr2.2008.11.023
NILSSEN, K. T., O-P. PEDERSEN, L. P. FOLKOW, and T. HAUG. 2000. Food consumption estimates of Barents Sea harp seals. NAMMCO Sci. Publ., 2: 9–27. http://dx.doi.org/10.7557/3.2968
NORDØY, E,. S., A. AAKVAAG., and T. S. LARSEN. 1993. Metabolic adaptations to fasting in harp seals. Physiol. Zool., 66: 926–945.
NORDØY, E., MÅRTENSSON, P.-E., A. R. LAGER, L. P. FOLKOW, and A. S. BLIX. 1995. Food consumption of the Northeast Atlantic stock of harp seals. In: Whales, Seals, Fish and Man. Proceedings the International symposium on the Biology of Marine Mammals in the Northeast Atlantic, Tromso, Norway. 29 Nov–1 Dec. 1994. A. S. Blix, L. Walloe and Ø. Ultang (eds.). Elsevier Science, NY, p. 255–260.
OFTEDAL, O. T., W. D. BOWEN, and D. J. BONESS. 1996. Lactation performance and nutrient deposition in pups of the harp seal, Phoca groenlandica, on ice floes off southeast Labrador. Physiol. Zool., 69: 635–657.
OFTEDAL, O. T., W. D. BOWEN, E. M. WIDDOWSON, and D. J. BONESS. 1989. Effects of suckling and the postsuckling fast on weights of the body and internal organs of harp and hooded seal pups. Biol. Neonate, 56: 283–300. http://dx.doi.org/10.1159/000243136
OLESIUK, P. F. 1993. Annual prey consumption by harbour seals (Phoca vitulina) in the strait of Georgia, British Columbia. Fish. Bull., 91: 491–515.
ØRITSLAND, N. A., and K. RONALD. 1975. Energetics of the free diving harp seal (Pagophilus groenlandicus). Rapp. P.-v. Réun. Cons. Int. Explor. Mer, 169: 451–454.
ØRITSLAND, N. A., and N. H. MARKUSSEN. 1990. Outline of a physiologically based model for population energetics. Ecol. Model., 52: 267-288. doi:10.1016/0304–3800(90)90020–H
REILLY, J. J. 1989. The energetics of lactation in grey seals (Halichoerus grypus). Abstract in the 8th Biennial Conference on the Biology of Marine Mammals, Pacific Grove, California, Dec. 7–11, 1989.
REILLY, J. J., and M. A. FEDAK. 1990. Measurement of the body composition of living gray seals by hydrogen isotope dilution. J. Appl. Physiol., 69: 885–891.
RENOUF, D., and R. GALES. 1994. Seasonal variation in the metabolic rate of harp seals: unexpected energetic economy in the cold ocean. Can. J. Zool., 72: 1625–1632. doi:10.1139/z94–216
ROFF, D., and W. D. BOWEN. 1986. Further analysis of population trends in the Northwest Atlantic harp seal (Phoca groenlandica) from 1967 to 1985. Can. J. Fish. Aquat. Sci., 43: 553–564. doi:10.1139/f86–066
RONALD, K., R. J. FRANK, J. L. DOUGAN, R. FRANK, and H. E. BRAUN. 1984. Pollutants in harp seals (Phoca groenlandica). I. Organochlorines. Sci. Total Environ., 38: 133–152. doi:10.1016/0048-9697(84)90212–2
RYG, M., and N. A. ØRITSLAND. 1988. Thermal significance of the topographical distribution of blubber in ringed seals (Phoca hispida). Can. J. Zool., 45: 985–992.
1991. Estimates of energy expenditure and energy consumption of ringed seals (Phoca hispida) throughout year. In: Proceedings of the Pro Mare Symposium on Polar Marine Ecology, Trondheim, 12–16 May 1990. E. Sakshaug, C. C. E. Hopkins, and N. A. Øritsland (eds.). Polar Res., 10: 595–601.
RYG, M., C. LYDERSEN, L. Ø. KNUTSEN, A. BJØRGE, T. G. SMITH, and N. A. ØRITSLAND. 1993. Scaling of insulation in seals and whales. J. Zool., 230: 193–206. doi:10.1111/j.1469–7998.1993.tb02682.x
SERGEANT, D. E. 1991. Harp seals, man and ice. Can. Spec. Publ. Fish. Aquat. Sci.,114: 1–153.
SHELTON, P. A., W. G. WARREN, G. B. STENSON, and J. W. LAWSON. 1997. Quantifying some of the major sources of uncertainty associated with estimates of harp seal prey consumption, Part II: Uncertainty in consumption estimates associated with population size, residency, energy requirement and diet. NAFO Sci. Coun. Studies, 26: 303–315.
SJARE, B., G. B. STENSON, and W. G. WARREN. 1996. Summary of female harp seal reproductive parameters in the Northwest Atlantic. Joint ICES/NAFO Working Group on Harp and Hooded Seals, Dartmouth, NS, 5–9 June 1995. NAFO Sci. Coun. Studies, 26: 41–46.
SLIP, D. J., N. J. GALES, and H. R. BURTON. 1992. Body mass loss, utilisation of blubber and fat, and energetic requirements of male southern elephant seals, Mirounga leonina, during the molting fast. Aust. J. Zool., 40: 235–243. doi:10.1071/ZO9920235
SPARLING, C. E. and M. A. FEDAK. 2004. Metabolic rates of captive grey seals during voluntary diving. J. Expt. Biol., 207: 1615–1624. doi:10.1242/jeb.00952
SPARLING, C. E., J. R. SPEAKMAN, and M. A. FEDAK. 2006. Seasonal variation in the metabolic rate and body compostion of female grey seals: fat conservation prior to high-cost reproduction in a capital breeder? J. Comp. Physiol. B, 176: 505–512. doi:10.1007/s00360–006–0072-0
STENSON, G. B., M. O. HAMMILL, and J. W. LAWSON. MS 1995. Predation of Atlantic cod, capelin, and Arctic cod by harp seals in Atlantic Canada. DFO Atlantic Fish. Res. Doc., 95/72, 29 p.
STEWART, R. E. A. 1986. Energetics of age-specific reproductive effort in female harp seals, Phoca groenlandica. J. Zool., 208: 503–517.
STEWART, R. E. A., and D. M. LAVIGNE. 1984. Energy transfer and female condition in nursing harp seals Phoca groenlandica. Holarct. Ecol., 7: 182–194.
STEWART, R. E. A., B. E. STEWART, D. M. LAVIGNE, and G. W. MILLER. 1989. Fetal growth of Northwest Atlantic harp seals, Phoca groenlandica. Can. J. Zool., 67: 2147–2157.
THOMAS, L., M. O. HAMMILL, and W. D. BOWEN. MS 2008. Assessment of Population Consequences of Harvest Strategies for the Northwest Atlantic grey seal population. Can. Sci. Advis. Sec. Res. Doc., 2008/78.
THOMPSON, D., P. S. HAMMOND, K. S. NICHOLAS, and M. A. FEDAK. 1991. Movements, diving and foraging behaviour of grey seals (Halichoerus grypus). J. Zool., 224: 223–232. doi:10.1111/j.1469–7998.1991.tb04801.x
TINKER, M. T., K. M. KOVACS, and M. O. HAMMILL. 1995. The reproductive behavior and energetics of male gray seals (Halichoerus grypus) breeding on a land-fast ice substrate. Behav. Ecol. Sociobiol., 35: 1–12.
TRITES, A. W., V. CHRISTENSEN, and D. PAULY. 1997. Competition between fisheries and marine mammals for prey and primary production in the Pacific Ocean. J. Northw. Atl. Fish. Sci., 22: 173–187. doi:10.2960/J.v22.a14
TRZCINSKI, M. K., R. MOHN, and W. D. BOWEN. 2006. Continued decline of an Atlantic cod population: how important is gray seal predation? Ecol. Appl., 16: 2276–2292. doi:10.1890/1051–0761(2006)016[2276:CDOAAC]2.0.CO;2
WALKER, B. G., and W. D. BOWEN. 1993. Changes in body mass and feeding behaviour in male harbour seals, Phoca vitulina, in relation to female reproductive status. J. Zool., 231: 423–436. doi:10.1111/j.1469–7998.1993.tb01929.x
WILLIAMS, T. 1999. The evolution of cost efficient swimming in marine mammals: limits to energetic optimization. Phil. Trans. R. Soc. Lond. B, 354: 193–201. doi:10.1098/rstb.1999.0371
WORTHY, G. A. J. 1985. Thermoregulation of young phocid seals. PhD Thesis, University of Guelph, Guelph, Ontario, Canada, 254 p.
1987a. Metabolism and growth of young harp and grey seals. Can. J. Zool., 65: 1377–1382. doi:10.1139/z87–217
1987b. Ecological energetics of harp and gray seals: Implications from a simulation model. In: Approaches to marine mammal energetics. A. C. Huntley, D. P. Costa, G. A. J. Worthy, and M. A. Castellini (eds.). Society for Marine Mammalogy Special Publication No. 1, p. 228–246
WORTHY, G. A. J. 1990. Nutritional energetics for marine mammals. In: CRC Handbook of marine mammal medicine: Health, disease, and rehabilitation. Chapter 28. Leslie A. Dierauf (eds.). CRC Press, Boca Raton, p. 489–520.
WORTHY, G. A. J., and D. M. LAVIGNE. 1982. Changes in blood properties of fasting and feeding harp seal pups, Phoca groenlandica, after weaning. Can. J. Zool., 60: 586–592. doi:10.1139/z82–087
1983a. Changes in energy stores during postnatal development of the harp seal, Phoca groenlandica. J. Mamm., 64: 89–96. doi:10.2307/1380753
1983b. Energetics of fasting and subsequent growth in weaned harp seal pups, Phoca groenlandica. Can. J. Zool., 61: 447–456.
1987. Mass loss, metabolic rate, and energy utilization by harp and gray seal pups during the postweaning fast. Physiol. Zool., 60: 352–364.
WORTHY, G. A. J., P. A. MORRIS, D. P. COSTA, and B. J. LE BOEUF. 1992. Molt energetics of the northern elephant seal (Mirounga angustirostris). J. Zool., 227: 257–265. doi:10.1111/j.1469-7998.1992.tb04821.x
YUNKER, G. B., M. O. HAMMILL, D. M. DION, J-F. GOSSELIN, AND J. F. SCHREER. 2005. Foetal Growth in Northwest Atlantic Grey Seals. J. Zool., 265: 1–9. doi:10.1017/S0952836905006503
|