Introduction
Using otoliths for species discrimination and fish prey identification in stomach contents
Investigations of species interactions in marine ecosystems and food habitats of seabirds, marine mammals and marine fishes almost always require analyses of stomach content data. In many cases the size, biomass, and hence the importance of prey cannot be directly determined because prey are often partly digested. However, the size of individual fish prey and hence their importance in the diet can partly be estimated from the otoliths, three pairs of small carbonate stones, or 'ear bones' located in the inner ear of teleost fishes (Degens et al., 1969; Härkönen, 1986; Campana, 1999). The largest otoliths, the sagitta, often remain undigested in stomachs of marine birds and fishes after muscular tissue and bones have been digested and are valuable indicators of the diet of piscivorous marine predators if they can be identified (Jobling and Breiby, 1986; Elliot et al., 1990). Fish otoliths contain only small percentages of water and organic matter (Templeman and Squires, 1956; Williams and Bedford, 1974; Degens et al., 1969; Campana, 1999) and their dimensions are often correlated with fish length (Templeman and Squires, 1956; Mini, 1967; Gauldie and Nelson, 1990; Hunt, 1992; Lombarte and Lleonart, 1993). In addition, size and shape, which vary among species, are reported to be species and sometimes stock specific (Boulva, 1972; Morrow, 1979; Frost, 1981; Härkönen, 1986; Hunt, 1992; Campana and Casselman, 1993; Lidster et al., 1994; Begg and Brown, 2000; Stransky, 2005; Doering-Arjes et al., 2008). Otoliths can be cleaned, dried, measured and weighed to great accuracy and are often collected in routine fisheries investigations for age determination as well as from predator stomachs (Williams and Bedford, 1974; Nielsen and Andersen, 2001). Hence, it is often possible to obtain very precise information on length, weight, age and quantity of individual fish prey if otolith size, and to some extent also, if fish size relationships have been determined. Morphological characteristics of otoliths have been documented for many marine fishes (Frost, 1981; Campana and Casselman, 1993; Begg et al., 2000). Among these is Atlantic cod (Gadus morhua) (Fridriksson et al., 1934; Hunt, 1992; Lidster et al., 1994; Cardinale et al., 2004; Berg et al., 2005; Doering-Arjes et al., 2008; Stransky et al., 2008) an important and well-studied predator (Daan, 1973; Palsson, 1983; Kikkert, MS 1993) that feeds primarily on crustaceans and fish in addition to being cannibalistic in the northwest Atlantic waters (Hansen, 1949; Palsson, 1983; Köster and Schober, MS 1990; Lilly, 1994; Methven, 1999; Nielsen and Andersen, 2001).
Cod otolith characteristics
Otolith length from Atlantic cod was found to be slightly curvelinear and to increase with length of cod between 40–320 mm FL (fork length) (Hunt, 1992; Lidster et al., 1994). In addition, characteristics of the sulcus, the longitudinal groove on the medial surface of the otolith, were found to be helpful for distinguishing otoliths of some species of very small gadids (Härkönen, 1986; Lidster et al., 1994). Also, otolith zones related to e.g. maturity and spawning variability by fish age can be characteristic of cod populations (Rollefsen, 1933; Fridriksson et al., 1934; Hüssy et al., 2009). Otolith length generally increases with fish length (loc. cit.) but this relationship is apparently not always a simple straight-forward one for fish in general (Mosegaard et al., 1988; Secor et al., 1989; Lombarte and Lleonard, 1993; Cardinale et al., 2004; Doering-Arjes et al., 2008; Checkley et al., 2009). Otolith lengths decline from 5% of the total length of fast growing haddock (Melanogrammus aeglefinus) at 14–17 cm to almost 3% at 74–77 cm (Templeman and Squires, 1956). Furthermore, older haddock have heavier and longer otoliths than younger fish of the same length indicating otoliths that have been carefully examined may assist with distinguishing different populations of fish (Templeman and Squires, 1956; Begg and Brown, 2000; Begg et al., 2000). Morphological characteristics of otoliths from Atlantic cod stocks have only been described in a few studies (e.g., Boulva, 1972; Hunt, 1992; Lidster et al., 1994; Cardinale et al., 2004; Berg et al., 2005; Doering-Arjes et al., 2008; Stransky et al., 2008). Studies describing otoliths of its sibling, Gadus ogac Richardson 1836, Greenland or rock cod, appear to be limited to Boulva (1972) and Härkönen (1986). For adult fish around 40 cm TL, Boulva (1972) distinguished otoliths between G. ogac and Arctogadus borisovi and A. glacialis. However, thorough comparative descriptions of otolith characteristics of juvenile G. morhua and G. ogac are not available, and characteristics to individually discriminate them from otoliths of other co-existing gadoids are not well known (Härkönen, 1986; Lidster et al., 1994; Campana, 2004). This is partly due to small juveniles of these sibling species not being previously distinguished (Methven and McGowan, 1998). These two species co-exist in coastal and bank areas off eastern Canada and western Greenland (Nielsen and Morin, 1993; Andersen et al., 1994; Methven and McGowan, 1998; Laurel et al., 2003) where distributions overlap and where they are exposed to the same predators including larger fish, seals, and small whales (e.g., Hansen, 1949; Nielsen, MS 1992a,b; Beck et al., 1993; Hammill et al., 1997; Stenson et al., 1997; Lawson et al., 1998; Methven, 1999; Vikingsson and Kapel, 2000; Nielsen and Andersen, 2001).
Objective and research hypotheses
The overall objective of our study is to identify characters that allow otoliths from individual G. morhua and G. ogac to be distinguished from each other taking into account possible zoogeographic variation between fish in Canadian and Greenland waters. Additionally we quantify otolith length, width and height relationships with respect to fish length such that species identity can be determined from individual otoliths removed from a predator’s stomach or from young fish surveys in Greenland and Canadian coastal waters (e.g., Nielsen and Andersen, 2001; Methven et al., 2003). We focus our efforts on juveniles less than 3 to 4 years of age with some as small as 40–50 mm, because this is the stage where otolith-fish relationships are poorly known and where otoliths are poorly described as well as where juveniles of the two species are not easily distinguished. The following three research hypotheses are tested in this study:
H01: Otoliths from juvenile and medium-sized specimens of Atlantic cod (G. morhua) and Greenland cod (G. ogac) from both Greenland and Canada can be identified to species based on otolith dimensions alone (otolith length, width and height) using discriminant function analysis (DFA) and principal component analysis (PCA).
H02: In order to distinguish otoliths from these two species using DFA and PCA, it is necessary to obtain additional information, i.e. fish length (total length or skeletal length) in addition to otolith dimensions mentioned above. Consequently, the relationships between otolith size and fish body size differ between G. morhua and G. ogac.
H03: As otolith twisting seems to be a significant factor in otolith difference between the two species (S.A. Horsted, former Director of Greenland Fisheries Research Institute, Copenhagen, Denmark; pers. comm.) the total otolith height is a major influential factor in discrimination of otoliths between the two species. These relationships can together with otolith information (otolith dimensions, fish size/age, zoogeographic location) be used in discriminating specimens from the two species.
Materials and Methods
Sampling off West Greenland
Gadus morhua and G. ogac were collected off west Greenland during experimental gillnet surveys in coastal waters (<40 m depth) during July 1987–1989 and during deeper water (30–200 m) long line surveys in autumn from 1987–1989. Sampling details and localities are given in Table 1 and Fig. 1. Gillnets had ten equal sized panels with mesh sizes of 16.5, 18.5, 24, 28 and 34 mm bar length (two panels per mesh size). The longline fishery was conducted with lines having 400 hooks (Mustad 2330 BD, No. 6) that were mounted on 50 cm snoods at 2-m intervals and baited with 11–17 cm recently thawed capelin (Mallotus villosus). This sampling resulted in a broad size range of cod (typically <30–40 cm TL from gillnets and >30 cm TL from longlines) being collected for otolith analyses. Refer to Hovgård (1996) and Nielsen (MS 1992a,b) for further details of the gillnet survey and to Hovgård and Riget (1992) and Nielsen and Andersen (2001) for details of the longline survey. Otoliths from 148 G. morhua (14–66 cm TL) and 138 G. ogac (20–70 cm TL) were arbitrarily selected among a very high total number of otoliths sampled (Nielsen, MS 1992a,b). Fish were measured (TL nearest cm), weighed (±5 g) and identified by the presence (G. morhua) or absence (G. ogac) of white pigment along the lateral line (Vladykov, 1945; Jensen, 1948). Sagitta otoliths were removed from randomly selected cod according to the area sampled, length group and sex. As a general rule, one otolith each from a female and a male from each 1 cm TL-class were selected within the length ranges sampled. Further details of otolith sampling and age determination are given by Nielsen (MS 1992a,b).
Sampling off eastern Canada
Three haul seines (Methven and Schneider, 1998) with 9 mm stretch mesh in the codend were used to catch age 0 and age 1 cod in coastal Newfoundland waters (Table 1 and Fig. 1). Most G. morhua and G. ogac were collected in water less than 10 m deep. Eighty-eight G. morhua (56–196 mm TL) and 92 G. ogac (64–258 mm TL) were collected. Fish were placed on ice shortly after being caught and were kept cold prior to having otoliths removed in the laboratory. All were identified to species using characters in Methven and McGowan (1998). We identified the smallest specimens of Gadus examined in this study (<75 mm) using a character not previously reported that was verified using starch gel electrophoresis. This character is based on the extent of pigmentation on finrays and membrane at the base of the posterior finrays on the first anal fin of G. ogac and G. morhua. The extent of pigmentation is greater in G. ogac than in G. morhua over the size range 40–75 mm. To test the validity of this character, we identified 100 G. ogac (n = 48) and G. morhua (n = 52) between 40–63 mm using starch gel electrophoresis that determined differences in the electrophoretic mobilities of creatine kinase and esterase proteins as previously demonstrated by Renaud et al. (1986). Each specimen was then re-identified using the extent of pigmentation on the first anal fin character in a blind test where the identification established by electrophoresis was not known to the person identifying the fish. Length and weight of individual fish were determined shortly after fish were identified and collected. Fish were measured for total length (mm) and blotted dry wet weight (0.1 g) prior to having otoliths removed. Each pair of sagittae was carefully cleaned using tap water and was stored dry in individually numbered envelopes.
Laboratory analyses
All otoliths from Greenland and Canada were carefully measured and aged in the laboratory in Denmark by the same person to ensure consistency of all length and weight measurements. Only completely intact sagittae were measured and used in this study. Otoliths were selected randomly from each envelope, there being no preference for otoliths from the right or left side of each fish. Cardinale et al. (2004) reported no significant differences between left and right side sagitta otoliths from G. morhua.
The maximum distances across each otolith with respect to otolith length (dimension 1), width (dimension 2), and height (dimension 3) were determined (Fig. 2) using a computerized Global Lab Image System (Data Translation, 1995). Otolith dimensions were computerized using a high resolution monochrome CCD video camera, mounted on a microscope and connected to a PC framegrabber card. Otoliths were placed with sulcus side up on a glass slide to measure dim1 and dim2 (length and width) and between two glass slides when estimating dim3 (height). The microscope magnification was adjusted to the size of the otoliths to obtain optimal high resolution. Measurements on images of small otoliths were made using a marker for each start and end point. Measurement units were calibrated with a calibration ruler (Graticule Ltd, Tonbridge, England). Larger otoliths were measured using an electronic digital sliding ruler (Mitutoyo 0–25 mm electronic ruler with precision 0.001 mm). Measurements of otolith length, width and height were obtained with a general precision of ±0.1 mm. Otolith weight was measured in mg with a general precision of ±0.2 mg.
Data and statistical analyses
Data were initially plotted to determine the extent of variation in body size-otolith (length, width, height, weight) relationships for G. morhua and G. ogac from off western Greenland and eastern Canada. Substantial overlap (discussed in Results) in otolith measurements between species and areas necessitated the use of statistical DFA based on a principal component analyses to correctly classify individual otoliths to species based on fish size, i.e., for unambiguous species specific pattern recognition and discrimination according to fish size. The statistical method was initially tested for pattern recognition using the otolith dimensions alone, and laterish. Analyses were carried out with the R-functions princomp (PCA), linear DFA discrimination (lda), and quadratic DFA discrimination (qda) using R-2.3.1 statistical software (Ithaka and Gentleman, 1996; R, 2007). Refer to Venables and Ripley (1996) for additional details. Variables included were fish species tested with respect to dependence of fish otolith dimensions and fish size according to country (area). This was done to determine the precise functional relationship between the otolith dimensions as well as for the relationships between fish-otolith-dimensions (length, height, width when using otolith dimensions in addition to fish size. The PCA and DFA analyses compared principal components among individual fish. Analyses were carried out with the R-functions princomp (PCA), linear DFA discrimination (lda), and quadratic DFA discrimination (qda) using R-2.3.1 statistical software (Ithaka and Gentleman, 1996; R, 2007). Refer to Venables and Ripley (1996) for additional details. Variables included were fish species tested with respect to dependence of fish otolith dimensions and fish size according to country (area). This was done to determine the precise functional relationship between the otolith dimensions as well as for the relationships between fish-otolith-dimensions (length, height, width), otolith weight, and fish size. In principle, the quadratic DFA requires data to have an underlying normal distribution (Venables and Ripley, 1996). To obtain normality, all variables were log-transformed. The Shapiro-Wilks test (Sokal and Rolf, 1995) in the R-2.3.1 Statistical Package was used to test for normality.
A series of linear and quadratic DFAs were tested to identify the best model to describe variability in the data. The linear DFA model used with different modifications was of the general form:
ldl = lda (species ~ length + dim1 + dim2 + dim3) (eq 1)
where ldl is the linear discrimination function, lda is linear discriminant analysis, length is total fish length (TL cm), and dim1 is otolith length (mm), dim2 is otolith width (mm), and dim3 is otolith height (mm).
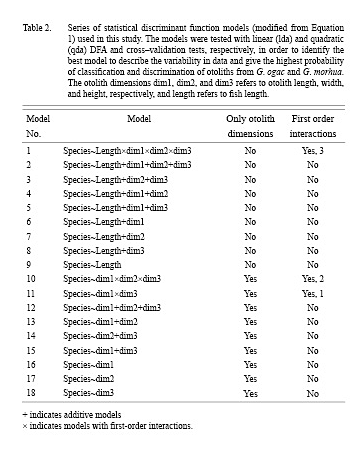
Modifications of the model are summarized in Table 22. Some DFAs included fish length (models 1–9), others did not (models 10–18). All models were basically additive models, but several included first-order interactions shown in Table 2. All models were tested both by linear (lda) and quadratic (qda) analysis. The aim was to obtain the highest discrimination possible by using the simplest model with as few descriptors and interaction terms as possible in order to avoid complex decision surfaces from the model (potentially highly influenced by noise in data) which are difficult to biologically explain and justify. The fewer descriptors, the higher robustness in relation to use and application of the model to new, future data.
The outcome of the cross-validation method is the probability (or proportion) of correct classification with 95% confidence limits as determined by the DFA model. Cross-validation was performed to validate the results obtained by the linear DFA models listed in Table 2. In this procedure, 50% of the observations were chosen at random to estimate a discrimination function and establish a prediction surface that was used to test how well one can predict the species when using the other half of the data. This was repeated 100 times to establish the probability of success (success frequency) of correct otolith classification. The final DFA models and resulting decision surfaces were selected based on their simplicity and ability to discriminate between species with the highest probability.
Visual examination of data for species discrimination
Gadus ogac are heavier at a given length than G. morhua (Fig. 3). This is most apparent at sizes greater than 30 cm, but is also evident with somewhat more overlap at sizes less than 150 mm (Fig. 3). Both species have similar and nearly isometric somatic body growth (Fig. 3) indicating that either fish length or fish weight can be used in the discriminant function analyses described below. The larger and more robust appearance of G. ogac is also evident in its otoliths which are slightly longer and heavier than otoliths removed from same sized G. morhua (Fig. 4 and Fig. 5). Overlap is evident for fish from Greenland and Newfoundland and is most apparent for otoliths from Greenland fish less than 30 cm and for otoliths from Newfoundland fish less than ca. 150 mm (Fig. 4 and Fig. 5) .
Overlap in otolith measurements, most apparent for the smallest and most difficult specimens to identify (Fig. 3 and Fig. 5) was not due to problems with misidentification. The smallest Gadus ogac and G. morhua examined in this study (40–75 mm) were distinguished from each other based on the extent of pigmentation at the base of the posterior most finrays and membrane of the first anal fin with pigmentation being more extensive in G. ogac than in similar size G. morhua. The error rate in a blind test using this character was 2% with 2 of 100 specimens being identified incorrectly when compared to identifications established using starch gel electrophoresis (Renaud et al. , 1986, Methven and McGowan, 1998). Both specimens that were misidentified were actually G. morhuawhen identifications were positively established using starch gel electrophoresis.
Statistical analysis of species discrimination
Fish otolith measurements (otolith length [dim1], otolith width [dim2], otolith height [dim3]) were tested for normality using the Shapiro-Wilk test. Otolith measurements from G. ogac were determined to be normally distributed (Greenland:W = 0.9670, p = 0.0256; Canada: W = 0.9750, p = 0.0100). Otolith measurements from G. morhua were only normally distributed for fish from Canada (Greenland: W = 0.9883, p = 0.2983; Canada: W = 0.9723, p = 0.0490). The linear DFA therefore seems to be the most fit method to use when evaluating results of the combined material G. morhua and G. ogac) given that the quadratic DFA in principle assumes an underlying normality of the data.
Results of the statistical models tested (Table 2) in the cross-validation procedure indicate the quadratic discriminant functions perform slightly better than the linear discriminant functions when only the otolith dimensions are included for both the additive and multiplicative models (Fig. 6 and Fig. 7). Quadratic discrimination based on otolith length and otolith height in an additive model gives a better discrimination in the cross-validation with probabilities of 0.71 (Greenland) and 0.80 (Canada) than the model where all otolith dimensions (length, width, height) are included which is the case for both areas (countries). The probability of correct classification using linear discrimination for the same additive model (otolith length and otolith height), is approximately 0.76 for Canada and 0.60 for Greenland (Fig. 6 and Fig. 7). The probability does not increase when all otolith dimensions are included.
Furthermore, when fish length is included in the analyses, the linear discrimination is preferred for fish from both Greenland and Canada (Fig. 6 and Fig. 7). When fish length is combined with information on otolith dimensions, the probability of correct classification of otoliths to species increases significantly to 0.9–1.0 in the cross-validation tests. Hence the DFAs can discriminate very well between species for both areas (countries) if fish length is known and included in the analyses (Fig. 6 and Fig. 7). For the most fit models the correlation increases only slightly from 0.92 in purely additive models to 0.93 in models including interaction terms for the Canadian fish. For the Greenland fish, the discrimination between species for the most fit models is 0.98–0.99 for additive models and models including interaction terms (Fig. 6 and Fig. 7). When looking at the overall material from both Greenland and Canada, the model giving best discrimination between species in the cross-validation is model 1 (Table 2) where otolith length, width and height in addition to fish length are included and where the first order interaction effects between all these variables are included. However, the resulting decision surface from this model is very complicated to explain biologically. Our aim has been to obtain a high discrimination of individual fish from both Greenland and Canada by using the simplest model with as few descriptors and interaction terms as possible in order to avoid complex decision surfaces which are difficult to biologically explain and justify. In multiplicative models, the decision surfaces are often very heterogeneous and there is an increased risk that the surfaces are influenced heavily by variability (noise) in the otolith measurements in the dataset. The latter makes multiplicative models less robust to other data applications. Models with fewer descriptors and simple decision surfaces have a higher robustness when new data sets are examined. On this basis, the additive models are preferred. The discrimination of individual fish between species in the combined material is high in the purely additive model 5 that includes otolith length and otolith height as well as fish length with a probability of correct classification between species of 0.97 in Greenland and 0.92 in Canada.
The power of this classification is considered to be high as relatively few variables are used on numerous individual fish to provide consistent results for fish from both Greenland and Canada. The power of the DFA and the cross-validation for detecting group differences relies on the ratio of observations (n) to number of variables (p). Stability and power increase as the ratio n:p increases (Cadrin, 2000). Furthermore, the power of the present classification is confirmed to be high by the significance of the cross-validation tests performed (see below) indicating robustness in the statistical results.
The linear decision surfaces and linear equations from which species identification can be determined are shown in Fig. 8. As there are differences in the results obtained between the Greenland and Canadian material, decision surfaces for both areas (countries) are given for several models. Based on the above principle of simplicity, Fig. 8 illustrates the results from the final selected additive DFA models. The probability of correct classification for the linear and quadratic discrimination, respectively, is given in Fig. 8 and is 0.59 (lda) and 0.68 (qda) for Greenland and 0.76 (lda) and 0.76 (qda) for Canada. When fish length and otolith width (model 7) are included for the Greenland material, the probability of a correct classification is increased to 0.98 (lda) and 0.98 (qda). When fish length and otolith height (model 8) are included for the Canadian material, the probability of correct classification is increased to 0.93 (lda) and 0.93 (qda). The statistics in relation to prior probabilities of groups as well as slope and intercept of the linear discriminant functions for these selected models are shown in Table 3. The linear functional relationships can be exemplified by model 15 for Canada as follows:
If Y > 0.805X – 1.343 for G. ogac (Eqn 2)
If Y < 0.805X – 1.343 for G. morhua (Eqn 3)
where X is the logarithm of dim1 and Y is the logarithm of dim3 (See Table 3). Similarly, other intercepts and slopes of the other models from Table 3 can be put into the above functional relationship in order to discriminate individual fish to species for fish from Canada or Greenland.
These results lead to partial acceptance of hypothesis H01 because it is only partly possible to discriminate between species based on otolith measurements alone, while the probability of correct classification and discrimination is very high when fish length is included. This finding leads to acceptance of hypothesis H02. When otolith height data are included, the probability of correct classification increases especially in the Canadian material where the smallest individuals of the two species were tested. This leads to acceptance of hypothesis H03 which appears to be especially valid for the smallest juvenile fish (<150 mm TL).
Discussion
Robustness and power of the results
Several different models were tested in the statistical DFA cross-validation procedures to determine otolith identification to species for individual fish. When only the otolith dimensions were included in the analyses, species recognition certainty was approximately 70% to 80% for the Greenland and Canadian fish, respectively. Only two of the three otolith dimensions (ototlith length and height) were necessary to obtain the highest degree of species separation. For both areas (countries), the species discrimination in the cross-validation performs significantly better when information on otolith dimensions is combined with total fish length. In this case, the probability of correct classification of species increases to levels between 0.9–1.0 in the cross-validation tests.
The power of the overall species classification success from the present results is strong. First, there are relatively few variables used in the analyses. These were taken from numerous individual fish and provide consistent results between the two main distribution areas sampled. The additive linear models containing a few variables and interaction terms are the simplest to explain biologically and hence are to a lesser degree influenced by variability (possible noise) in the data, i.e., are more biologically robust. Finally, the strong power of the present species recognition and classification is also evident from the statistical significance of the cross-validation tests performed on the full material indicating high robustness in the statistical results.
The ability to distinguish between otoliths of these two species is an important finding given that species identification has proven difficult where these species co-occur in fisheries surveys and in stomach samples from predators. In this context, possible zoogeographical variation in otolith dimensions must be examined and potential impacts of different environmental and hydrographical conditions in different habitats need to be considered (e.g., between western Greenland / eastern Canada). This study solves this problem by providing a robust statistical quantitative method and simple model for individual fish otolith discrimination and species separation in different areas when only basic and easily obtainable otolith dimensions and fish length are available, for example in the stomach contents of predators. Prey skeletal remains are often present and available for a longer period after ingestion from which fish length and basic otolith measurements can be used to determine species and hence composition of prey in stomachs of predators. The results show that species and prey identity of individual fish can be determined with certainties exceeding 90%, making the method efficient in relation to data from future stomach sampling programs and young fish surveys.
Context of other methods used for species separation of G. ogac and G. morhua
A methodology based on morphometrics for species separation has been reported for larger fish (Methven and McGowan, 1998). For specimens of intact fish taken in fisheries surveys (e.g., Hovgård and Riget, 1992; Methven et al., 2003), two simple characters can be used to distinguish between G. ogac and G. morhua. Specimens larger than 100 to 140 mm can be distinguished by the presence of white pigmentation along the lateral line of G. morhua and by its absence in G. ogac (Vladykov, 1945; Jensen, 1948; Methven and McGowan, 1998). The results in the present paper also indicate species-specific differences in fish condition for larger fish in both areas (countries). However, the latter can be influenced by environmental conditions (Dutil et al., 1999). For Gadus specimens smaller than those examined by Methven and McGowan (1998), i.e., less than 87 mm, we report that the extent of pigmentation at the base of the posterior most finrays on the first anal fin is greater in G. ogac than in G. morhua over the size range 40–75 mm. The error rate in a blind test using this character was only 2% when specimens were identified to species using starch gel electrophoresis (Renaud et al., 1986; Methven and McGowan, 1998). Hence intact specimens of these two species can be distinguished at sizes as small as ca. 40 mm, approximately the size of settlement off eastern Canada. However, these species are more difficult to distinguish when determining their abundance and composition in predator stomachs.
Visual examination of body weight versus length showed distinct discrimination between individuals of the two species for the larger size groups investigated (>150 mm TL), but not for the smaller, juvenile specimens. Weight was also one character used to distinguish between G. ogac and G. morhua over the size range 87–135 mm when examined using discriminant function analyses (Methven and McGowan, 1998). Results presented in the present paper indicate both species are close to achieving isometric body growth (which will be somatic growth for the juveniles). Possible discrimination between larger specimens based on their body length-weight relationship might be influenced by sexual maturation and growth of the gonads. Furthermore, this method is not useful for individuals in predator stomach contents where the body weight estimate will be biased by digestion and the more rapid decomposition (degradation) of the soft body tissue (protein, lipid, muscle, and fat tissue, pigments, etc.) compared to the bone and cartilage tissue used in the length measurement of prey organisms. Also, otolith dimensions and weight at a given fish body length is most different for the larger specimens, while these interspecific differences are not as obvious for the smaller individuals. Consequently, visual examination is not adequate to identify un-ambiguous distinctive patterns for species discrimination by size for the smallest fish.
Otolith characteristics and relevant factors introducing variability in otolith morphology
Twistedness of otoliths appears to be an important character to discriminate between otoliths of G. morhua and G. ogac (S. A. Horsted, Greenland Fisheries Research Institute, Copenhagen, pers. comm., and based on an initial blind test otolith separation trial). In general, otoliths are more twisted as otolith height increases. When otolith height (being a measure of the degree of otolith twistedness) is included in the model, the probability of correct classification increases (Fig. 6 and Fig. 7). This is especially so for the smallest specimens examined from Canada. Boulva (1972) reported that the otoliths of G. ogac are curved, and found that ratios of otolith width to otolith thickness indicated little resemblance between Arctogadus and G. ogac. He found that regression between otolith width and thickness showed statistical significant (p <0.001) different slope and intercept between the species which was most profound for larger otoliths. Lidster et al. (1994) made comparative descriptions and identified by eye features and characteristics that might be helpful in distinguishing sagittal otoliths from juvenile G. morhua and Boreagadus saida, but no quantitative and statistical models were established to support this and reveal statistical significant differences between species. A main feature of G. morhua otoliths is the curvature along the longitudinal axis where the lateral surface was more concave and had more furrows in addition to containing crenulation around the entire periphery, compared to B. saida otoliths. Also, the G. morhua otolith had a more developed sulcus compared to B. saida. However, they did not describe how they avoided confusion between small G. morhua and G. ogac in their material from coastal waters in Newfoundland where these two species are widely and densely distributed and co-exist. The above characteristics will evidently not enable distinction between G. morhua and G.ogac otoliths as they both possess extensive curvature as described above, and G. ogac otoliths also have a well-developed sulcus. Also when Hunt (1992) analyzed Atlantic cod otoliths for fish down to 9 cm in length to be distinguished from species of haddock (Melanogrammus aeglefinus), pollock (Pollachius virens) and silver hake (Merluccius bilinearis) sampled from surveys and fishery in Canadian waters, he did not discuss potential confusion of small G. morhua and G. ogac in his material.
As the two species co-exist and reproduce in the same areas of both western Greenland and eastern Canada coastal waters (Nielsen and Andersen, 2001; Nielsen and Morin, 1993; Andersen et al., 1994; Methven and McGowan, 1998), possible zoogeographical variation in otolith dimensions and potential impacts of different environmental and hydrographical conditions in different habitats needs to be considered in an otolith separation study. Environmental conditions and habitat variables such as temperature, carbon dioxide levels and feeding conditions, as well as demographics such as age, sex, stock, and year class specific effects, have been found to impact (allometric) growth in otolith shape being a possible confounding effect in otolith shape analyses in other studies on, for example, sea trout, haddock and Atlantic cod (e.g., Campana and Casselman, 1993; Begg and Brown, 2000; Begg et al., 2000; Simoneau et al., 2000; Cadrin, 2000; Cardinale et al., 2004; Doering-Arjes et al., 2008; Checkley et al., 2009). The obtained results of intra- and inter-specific differences are robust in this respect as the tested individuals were carefully selected and designed to have broad geographical coverage in the overlapping distribution areas of Greenland and Canada. Greenland and Canadian individuals were tested separately, but the tests showed consistent results across areas.
Several individuals from each fish length group of a very broad fish size spectrum of both sexes and species were sampled to take account of possible size-specific differences and regional effects including potential variability (noise) from intraspecific size variation. Also, to avoid confounding effects of fish length and age, a broad and continuous spectrum of both size and known age fish were included in the analyses. Several years and year-classes (covering the same year classes by species) were examined. The two species have been sampled at the same sites over the sampling period (multiple years) and during the same periods (seasons) covering both inshore and coastal waters by area. This increases the likelihood that the fish have been exposed to broad and similar environmental conditions in each area, as well as there is broad coverage of different types of habitats and environments in each area, to average out potential effects of such factors. Finally, right and left sagittal otoliths were sampled arbitrarily to avoid effects from this factor as well.
Context of methodologies for otolith analyses and discrimination
Several methods are used in otolith discrimination studies for different purposes. For discrimination of individual fish and for species recognition and classification, the multi-variate analysis of variance of linear otolith descriptors in DFA and cross-validation tests have been used in the present study.
Comparison of univariate body dimensions has been shown to be ineffective to discriminate different groups (stocks) of the same species, because distributions usually overlap extensively (King, 1985; Cadrin, 2000). In stock separation, bivariate allometry modeling of relative growth of any two morphometric features has been widely used to separate populations within the same species, however, the assumption of homogeneous growth within a morphological character is a problem here (Cadrin, 2000). Multivariate allometry of otolith form, which is usually multi-dimensional and with geographic variation, has been used in simultaneous multivariate analysis of a representative array of characters to detect and identify shape differences among groups of fish (e.g., Teissier, 1960; Cadrin, 2000). Here the PCA method is typically used on several log transformed dimensions. The first principal component (PC1) typically indexes a weighted combination of all variables interpreted as an index of general size variation because all dimensions increased during (isometric) growth and were positively correlated (Teissier, 1960; Cadrin, 2000). The second principal component (PC2) typically indexes the residual variance due to shape differences between groups arising from (allometric) developmental change in form. Group separation based on interpreting size and shape from PCA is reasonable if PC1 accounts for large successive portions of morphometric variance with stable eigenvectors, however, there is a risk for confounding the within-group and among-group variability in pooled-group PCA (Cadrin, 2000).
An alternative method for multi-group analysis is the DFA as used in the present study. DFA tests significance of group differences in variation and co-variation of several variables by deriving a weighted combination of the variables which maximizes differences among taxonomic groups (Bolles and Begg, 2000; Cadrin, 2000). Unlike PCA, which emulates a multivariate allometric equation, DFA is not as biologically interpretable (Cadrin, 2000). As in the present study, the DFA from specimens with known group or species membership (intrinsic data) can be used to classify specimens with unknown membership and allows for testing classification accuracy through cross-validation.
Development of computer-aided image analysis systems have facilitated progress and diversification of morphometric studies and geometric analysis approaches as well as the capability to increase the number of observations in relation to the number of variables (MacLeod, 1990; Rohlf, 1990; Cadrin and Friedland, 1999). Geometric methods including shape analyses are categorized as either "outline methods" or "landmark methods" (Cadrin, 2000). The most common outline method involves fitting of Fourier series to the point coordinates along the perimeter of the morphometric feature, and the Fourier coefficients have commonly been used as multivariate observations for DFA covering outer otolith and scale shape for discriminating fish stocks (Friedland, MS 1996; Cadrin, 2000; Stransky et al., 2008). Also, geometric landmark coordinate methods have been used to quantify deformations of morphometric points in coordinate space (i.e., to quantify change in shape from a reference and an "average" shape) to study ontogenetic changes and geographic variation in fish otoliths. Several authors have investigated shape of otoliths to classify groups and populations of fish to stocks and species (e.g., L’Abée-Lund, 1988; Campana and Casselmann, 1993; Begg and Brown, 2000; Stransky, 2005; Stransky and MacLellan, 2005; Stransky et al., 2008). This method was also used to make the fish ageing processes more objective and accurate and calibrate population age structure by including information on otolith morphometrics and otolith shape (Doering-Arjes et al., 2008). Even though Fourier coefficients in outline methods and landmark methods can be used to discriminate stocks they are often criticized for not enabling clear biological interpretation of group differences. This is because Fourier coefficients in outline methods and the warps from a reference shape in landmark methods can only be considered as "biologically arbitrary variables" (Bookstein et al., 1982; Lohmann and Schweitzer, 1990; Rohlf and Marcus, 1993; Rohlf, 1998; Cadrin, 2000). Critics point out that Fourier coefficients are not homologous among specimens, that landmarks must be fixed in coordinate space, and that landmark methods can only define morphological location and orientation of principal deformations to guide the choice of variables for more traditional analyses of linear distances such as DFA (Bookstein et al., 1982; Rohlf and Marcus, 1993; Cadrin, 2000). External structures like shape of the otolith reflect phenotype expressions that are mainly influenced by species, sex, age, year class, stock and environment (Begg and Brown, 2000; Doering-Arjes et al., 2008). Accordingly, Fourier transcription methods are most efficient when discriminating between groups or stocks of fish (e.g., Stransky et al., 2008), but are not so well suited and easy interpretable when the aim is to identify and classify individual fish to a certain species as in the present study.
In conclusion, form projection and shape analysis methods cannot be biologically interpreted as easily as the few multivariate variables with linear distances used in the DFA and cross-validation tests in the present study. This is because the typically complex and large number of Fourier-transformed descriptors may result in over-parameterization of models in shape analysis of average population distinctions. Another reason for not using form projection analysis with image recognition methods here is the lower efficiency of this method when a main discrimination character is twistedness of the otoliths where otolith height has significant influence. The G. ogac otoliths appear to be more twisted than otoliths from G. morhua. Form projection of otolith morphometrics, where normalized and size corrected elliptical Fourier descriptors of otolith outline shape is typically used resulting in digital silhouette images and multivariate shape analysis (Stransky and MacLellan, 2005), is not optimal for determining twistedness and height of the otoliths. Accordingly, this method is not optimal for species discrimination in present context.
Implementation of the method and future studies
The present method and results are easy to implement in fish stock monitoring (e.g., in fisheries research surveys and in commercial fishery on board and/or market sampling) as well as in stock assessment and management of cod resources in the investigated areas. Our method is very efficient for application. The highest level of identification is achieved when both body size and otolith dimensions are analysed together in the same model. With respect to identification of stomach contents, determining the fish length will sometimes not be as reliable as in relation to other monitoring. The results indicate a simple and efficient method for species discrimination by use of a few, easily identifiable, and obtainable otolith and fish body characters, and it provides a simple to use and robust functional relationship and statistical discrimination procedure. Furthermore, the method is relatively simple to explain biologically, and the cross validation feature increases the power and robustness of the classification method.
However, future studies should be performed to investigate a range of other possible morphological relationships, various vectors across the surface of the otolith, and shape analysis features that would produce discrimination models that would not be over specified, which is the risk of Fourier shape analyses and related methods. As twistedness may be an important character in species difference there might very well be potential in identifying other morphological relationships and shape analysis features. In the present study, we have focused on finding a few very simple, robust, easily identifiable and easy to explain biologically characters that are not easy to mis-identify and mis-interprete in the estimation process. Such easy to identify and easy to measure characteristics are cost-effective both with respect to resource and time demands for processing, and they increase the likelihood of implementation of the method.
Acknowledgements
We thank the Institute of Natural Resources, (former Greenland Fisheries Research Institute), Home Rule, Greenland, for providing the Greenland material for these analyses. We also thank Holger Hovgård, Institute of Natural Resources, Greenland, for valuable discussions in relation to the present investigations. The Technical University of Denmark, National Institute for Aquatic Resources (DTU-Aqua), (former Danish Institute for Fisheries Research), provided laboratory facilities, image analysis hardware and software for the laboratory analyses performed on the full material, as well as all statistical analysis software and expertise. We thank Helge Paulsen, DTU Aqua, for advice on use of the Global Lab Image System and its results.
The authors of this paper have equal status.
References
ANDERSEN, O. G. N., J. R. NIELSEN, and E. L. B. SMIDT. 1994. Description and comparison of eggs and yolk sac larvae of Greenland cod (Gadus ogac), Atlantic cod (Gadus morhua) and Arctic cod (Boreogadus saida) from West Greenland waters. J. Northw. Atl. Fish. Sci., 16: 19–32. doi:10.2960/J.v16.a2
BECK, G. G., M. O. HAMMILL, and T. G. SMITH. 1993. Seasonal variation in the diet of harp seals (Phoca groenlandica) from the Gulf of St. Lawrence and western Hudson Strait. Can. J. Fish. Aquat. Sci., 50: 1363–1371. doi:10.1139/f93-156.
BEGG, G., and R. BROWN. 2000. Stock identification of haddock Melanogrammus aeglefinus on Georges Bank based on otolith shape analysis. Trans. Am. Fish. Soc., 129: 935–945 doi:10.1577/1548-8659(2000)129<0935:SIOHMA>2.3.CO;2.
BEGG, G., W. J. OVERHOLTZ, and N. J. MUNROE. 2000. The use of internal otolith morphometrics for identification of haddock (Melanogrammus aeglefinus) stocks on Georges Bank. Fish. Bull., 99: 1–14.
BERG, E., T. H. SARVAS, A. HARBITZ, S. E. FEVOLDEN, and A. B. SALBERG. 2005. Accuracy and precision in stock separation of northeast Arctic and Norwegian coastal cod by otoliths – comparing readings, image analyses and a genetic method. Mar. Freshwater Res., 56: 753–762. doi:10.1071/MF04172
BOLLES, K. L., and G. A. BEGG. 2000. Distinction between silver hake (Merluccius bilinearis) stocks in U.S. waters of the northwest Atlantic based on whole otolith morphometrics. Fish. Bull., 98: 451–462.
BOOKSTEIN, F. L., R. E. STRAUSS, J. M. HUMPHRIES, B. CHERNOFF, R. L. ELDER, and G. R. SMITH. 1982. A comment on the use of Fourier methods in systematics. Syst. Zool., 31: 85–92. doi:10.2307/2413416
BOULVA, J. 1972. Morphometrics of three sympatric Arctic codfishes of the genera Arctogadus and Gadus. J. Fish. Res. Bd. Can., 29: 243–249.
CADRIN, S. X. 2000. Advances in morphometric identification of fishery stocks. Rev. Fish Biol. Fisher., 10: 91–112. doi:10.1023/A:1008939104413
CADRIN, S. X., and K. D. FRIEDLAND. 1999. The utility of image processing techniques for morphometric analysis and stock identification. Fish. Res., 43: 129–139. doi:10.1016/S0165-7836(99)00070-3
CAMPANA, S. E. 1999. Chemistry and composition of fish otoliths: pathways, mechanisms and applications. Mar. Ecol. Prog. Ser., 188: 263–297. doi:10.3354/meps188263
2004. Photographic atlas of fish otoliths of the Northwest Atlantic Ocean. Can. Spec. Publ. Fish. Aquat. Sci., No. 133.
CAMPANA, S. E., and J. M. CASSELMAN. 1993. Stock discrimination using otolith shape analysis. Can. J. Fish. Aquat. Sci., 50: 1062–1083. doi:10.1139/f93-123
CARDINALE, M., P. DOERING-ARJES, M. KASTOWSKY, and H. MOSEGAARD. 2004. Effects of sex, stock, and environment on the shape of known-age Atlantic cod (Gadus morhua) otoliths. Can. J. Fish. Aquat. Sci., 61: 158–167. doi:10.1139/f03-151
CHECKLEY, D. M., A. G. DICKSON, M. TAKAHASHI, J. A. RADICH, N. EISENKOLB, and R. ASCH. 2009. Elevated CO2 enhances otolith growth in young fish. Science, 324 (5935): 1683. doi:10.1126/science.1169806
DAAN, N. 1973. A quantitative analysis of the food intake of North Sea cod, Gadus morhua. Neth. J. Sea Res., 6: 479–517. doi:10.1016/0077-7579(73)90002-1
DATA TRANSLATION, INC. 1995. GLOBAL LAB Image SP0550. Image processing and analysis software for Microsoft Windows UM-10544-G. DT-Open Layers for Microsoft Windows. Data Translation Inc., 100 Locke Drive, Marlboro, MA 01752, USA.
DEGENS, E. T., W. G. DEUSER, and R. L. HAEDRICH. 1969. Molecular structure and composition of fish otoliths. Mar. Biol., 2: 105–113. doi:10.1007/BF00347005
DOERING-ARJES, P., M. CARDINALE, and H. MOSEGAARD. 2008. Estimating population age structure using otolith morphometrics: a test with known-age Atlantic cod (Gadus morhua) individuals. Can J. Fish. Aquat. Sci., 65: 2342–2350. doi:10.1139/F08-143
DUTIL, J.-D., M. CASTONGUAY, D. GILBERT, and D. GASCON. 1999. Growth, condition, and environmental relationships in Atlantic cod (Gadus morhua) in the northern Gulf of St. Lawrence and implications for management strategies in the Northwest Atlantic. Can. J. Fish. Aquat. Sci., 56: 1818–1831. doi:10.1139/cjfas-56-10-1818
ELLIOT, R. D., P. C. RYAN, and W. W. LIDSTER. 1990. The winter diet of thick-billed murres in coastal Newfoundland waters. Stud. Avian Biol., 14: 125–138.
FRIDRIKSSON, A., P. M. HANSEN, A. F. BRUUN, and Aa. VEDEL TÅNING. 1934. Report concerning the analysis of cod otoliths from Iceland. Cons. Int. Explor. Mer, Rapp. Proc-Verb., Vol. 86, Art. 5, 14 p.
FRIEDLAND, K. D. MS 1996. Analyses of calcified structures – Fourier shape analysis. ICES CM 1996/M:1, p. 17–20.
FROST, K. J. 1981. Descriptive key to the otoliths of gadid fishes of the Bering, Chukchi, and Beaufort Seas. Arctic, 34: 55–59.
GAULDIE, R. W., and D. G. A. NELSEON. 1990. Otolith growth in fishes. Comp. Biochem. Physiol., 97: 119–135. doi:10.1016/0300-9629(90)90159-P
HAMMILL, M. O., C. LYDERSEN, K. M. KOVACS, and B. SJARE. 1997. Estimated fish consumption by Hooded seals (Cystophora cristata) in the Gulf of St. Lawrence. J. Northw. Atl. Fish. Sci., 22: 249–257. doi:10.2960/J.v22.a18
HANSEN, P. M. 1949. Studies on the biology of the cod in Greenland waters. Rapp. P.-v. Reun. Cons. int. Explor. Mer., 123: 1–83.
HÄRKÖNEN, T. 1986. Guide to the otoliths of the bony fishes of the Northeast Atlantic. Danbiu ApS. Biological Consultants,. Henningsens Alle 58. DK-2900, Hellerup, Denmark, ISBN 87-982290-2-8, 256 p.
HOVGÅRD, H. 1996. A two-step approach to estimating selectivity and fishing power of research gill nets used in Greenland waters. Can. J. Fish. Aquat. Sci., 53: 1007–1013. doi:10.1139/cjfas-53-5-1007
HOVGÅRD, H., and F. F. RIGET. 1992. Comparison of longline and trawl selectivity in cod surveys off West Greenland. Fish. Res., 13: 323–333. doi:10.1016/0165-7836(92)90085-8
HUNT, J. J. 1992. Morphological characteristics of otoliths for selected fish in the North-West Atlantic. J. Northw. Atl. Fish. Sci., 13: 63–75. doi:10.2960/J.v13.a5
HÜSSY, K., B. NIELSEN., H. MOSEGAARD, and L. WORSØE CLAUSEN. 2009. Using data storage tags to link otolith macro-structure in Baltic cod Gadus morhua with environmental conditions. Mar. Ecol. Prog. Ser., 378: 161–170. doi:10.3354/meps07876
ITHAKA, R., and R. GENTLEMAN. 1996. R: A Language for Data Analysis and Graphics. J. Comp. Graph. Stat., 5: 299–314. doi:10.2307/1390807
JENSEN, A. S. 1948. Contributions to the Ichtyofauna of Greenland 9 (8-24). Bianco Lunos Bogtrykkeri A/S, Copenhagen, Denmark, 182 p.
JOBLING, M., and A. BREIBY. 1986. The use and abuse of fish otoliths in studies of feeding habits of marine piscivores. Sarsia, 71: 265–274.
KIKKERT, A. H. MS 1993. Analysis of the cod samples collected in the North Sea during the 1991 international stomach sampling project. ICES C.M. 1993/G13, 34 p.
KING, D. P. F. 1985. Morphological and meristic differences between spawning aggregations of northeast Atlantic herring, Clupea harengus L. J. Fish. Biol., 26: 591–607. doi:10.1111/j.1095-8649.1985.tb04300.x
KÖSTER, F. W., and W. SCHOBER. MS 1990. Cod stomach sampling in West-Greenland waters 1989 - some preliminary results. NAFO SCR. Doc., No. 33, Serial No. N1750, 13 p.
L’ABÉE-LUND, J. H. 1988. Otolith shape discrimination between juvenile Atlantic salmon, Salmo salar, and brown trout, Salmo trutta. J. Fish Biol., 33: 899–903. doi:10.1111/j.1095-8649.1988.tb05538.x
LAUREL, B. J., R. S. GREGORY, and J. A. BROWN. 2003. Settlement and distribution of age-0 juvenile cod, Gadus morhua and G. ogac, following a large-scale habitat manipulation. Mar. Ecol. Prog. Ser., 262: 241–252. doi:10.3354/meps262241
LAWSON, J. W., J. T. ANDERSON, E. L. DALLEY, and G. B. STENSON. 1998. Selective foraging by harp seal Phoca groenlandica in nearshore and offshore waters of Newfoundland, 1993 and 1994. Mar. Ecol. Prog. Ser., 168: 1–10. doi:10.3354/meps163001
LIDSTER, W. W., G. R. LILLY, and E. G. DAWE. 1994. Otoliths of Arctic cod (Boreogadus saida), small Atlantic cod (Gadus morhua), and three other fish species from Newfoundland Waters: Description and relationship of body length to otolith length. J. Northw. Atl. Fish. Sci., 16: 33–40. doi:10.2960/J.v16.a3
LILLY, G. R. 1994. Predation by Atlantic cod on capelin on the southern Labrador and Northeast Newfoundland shelves during a period of changing spatial distributions. ICES Mar. Sci. Symp., 198: 600–611.
LOHMANN, G. P., and P. N. SCHWEITZER. 1990. On eigenshape analysis. In: F. J. Rohle and F. L. Bookstein (eds.). Proceedings of the Michigan Morphometrics Workshop. Univ. Michigan Mus. Zool. Spec. Pub., No. 2, p. 147–166. http://deepblue.lib.umich.edu/bitstream/2027.42/49535/1/michigan_morphometrics.pdf
LOMBARTE, A., and J. LLEONART. 1993. Otolith size changes related with body growth, habitat depth and temperature. Environ. Biol. Fishes, 37: 297–306.
MACLEOD, N. 1990. Digital images and automated image analysis systems. In: F. J. Rohle and F. L. Bookstein (eds.). Proceedings of the Michigan Morphometrics Workshop. Univ. Michigan Mus. Zool. Spec. Pub., No. 2, p. 21–36. http://deepblue.lib.umich.edu/bitstream/2027.42/49535/1/michigan_morphometrics.pdf
METHVEN, D. A. 1999. Annotated Bibliography of Demersal Fish Feeding with Emphasis on Selected Studies from the Scotian Shelf and Grand Banks of the Northwestern Atlantic. Can. Tech. Rept. Fish. Aquat. Sci., No. 2267, 106 p.
METHVEN, D. A., and C. MCGOWAN. 1998. Distinguishing juvenile Atlantic cod (Gadus morhua) from Greenland cod (Gadus ogac) in coastal Newfoundland habitats: a comparison of meristic, protein electrophoresis and discriminant function analyses of morphometric data. Can. J. Zool., 76: 1054–1062. doi:10.1139/cjz-76-6-1054
METHVEN, D. A., and D. C. SCHNEIDER. 1998. Gear-independent patterns of variation in catch of juvenile cod (Gadus morhua) in coastal habitats. Can. J. Fish. Aquat. Sci., 55: 1430–1442. doi:10.1139/cjfas-55-6-1430
METHVEN, D. A., D. C. SCHNEIDER, and G. A. ROSE. 2003. Spatial pattern and patchiness during ontogeny: post-settled Gadus morhua in coastal Newfoundland. ICES J. Mar. Sci., 60: 38–51.
MINI, M. V. 1967. Study of the relation between the weight of an otolith (sagitta) and the length of an individual in the cod population of the Barents and White Seas. Fish. Res. Bd Can. Translation Series, No. 1990, 10 p.
MORROW, J. E. 1979. Preliminary keys to otoliths of some adult fishes of the Gulf of Alaska, Bering Sea, and Beaufort Sea. NOAA Tech. Rep., NMFS CIRC-420, 32 p.
MOSEGAARD, H., H. SVEDÄNG, and K. TABERMAN. 1988. Uncoupling of somatic and otolith growth rates in Arctic char (Salvelinus alpinus) as an effect of differences in temperature response. Can. J. Fish. Aquat. Sci., 45: 1514–1524. doi:10.1139/f88-180
NIELSEN, J. R. MS 1992a. Uvakkens Biologi Gadus ogac (Richardson). (The biology of Greenland cod, Gadus ogac (Richardson)). Report to the Home Rule, Greenland. Greenland Fisheries Research Institute, Copenhagen, ISBN 87-87838-93-1, 119 + 5 p. [In Danish; summary in Greenlandic]
1992b. Growth of Greenland cod, Gadus ogac, in the Nuuk area of West Greenland. ICES CM 1992/G:32, 28 p.
NIELSEN, J. R., and M. ANDERSEN. 2001. Feeding habits and density patterns of Greenland cod, Gadus ogac (Richardson 1836), at West Greenland compared to those of the coexisting Atlantic cod, Gadus morhua L. J. Northw. Atl. Fish. Sci., 29: 1–22. doi:10.2960/J.v29.a1
NIELSEN, J. R., and R. MORIN. 1993. Bibliography of Greenland cod, Gadus ogac Richardson, 1780–1992. Can. Manuscr. Rep. Fish. Aquat. Sci., No. 2191. 28 p.
PALSSON, O. K. 1983. The feeding habits of demersal fish species in Icelandic waters. J. Mar. Res. Inst. Reykjavik, 7: 1–60.
R DEVELOPMENT CORE TEAM 2007. R: A language and environment for statistical computing. R Foundation for Statistical Computing. Vienna, Austria. http://www.r-project.org/
RENAUD, C. B., L. I. SPEERS, S. U. QADRI, and D. E. MCALLISTER. 1986. Biochemical evidence of speciation in the cod genus Gadus. Can. J. Zool., 64: 1563–1566. doi:10.1139/z86-233
RICHARDSON, J. 1836. The Fish. In: Fauna Boreali-Americana; or the zoology of the northern parts of British America containing descriptions of the objects of natural history collected on the late northern land expeditions under the command of Sir J. Franklin R. N., 3 (1–15): 1–327.
ROHLF, F. L. 1990. An overview of image processing and analysis techniques for morphometrics. In: F. J. Rohlf and F. L. Bookstein (eds.). Proceedings of the Michigan Morphometrics Workshop. Univ. Michigan Mus. Zool. Spec. Pub., No. 2, p. 37–60. http://deepblue.lib.umich.edu/bitstream/2027.42/49535/1/michigan_morphometrics.pdf
1998. On applications of geometric morphometrics to studies on ontogeny and phylogeny. Syst. Biol., 47: 147–158. doi:10.1080/106351598261094
ROHLF, F. L., and L. F. MARCUS. 1993. A revolution in morphometrics. Trends Ecol. Evol., 8: 129–132. doi:10.1016/0169-5347(93)90024-J
ROLLEFSEN, G. 1933. The otoliths of the cod. Rep. Norweg. Fish. Maritime Invest., Vol. IV, No. 3. A.s. John Griegs Boktrykkeri, Bergen.
SECOR, D. H., J. M. DEAN, and R. B. BALDEVARONA. 1989. Comparison of otolith growth and somatic growth in larval and juvenile fishes based on otolith length/fish length relationships. Rapp. P.v. Réun. Cons. Int. Explor. Mer, 191: 431–438.
SIMONEAU, M., J. M. CASSELMAN, and R. FORTIN. 2000. Determining the effect of negative allometry (length/height relationships) on variation in otolith shape in lake trout (Salvelinus namaycush). Can. J. Zool., 78: 1597–1603. doi:10.1139/cjz-78-9-1597
SOKAL, P. R., and F. J. ROHLF. 1995. Biometry. 3rd ed. W.H. Freeman & Company, New York, 887 p.
STENSON, G. B., M. O. HAMMILL, and J. W. LAWSON. 1997. Predation by harp seals in Atlantic Canada: Preliminary consumption estimates for Arctic cod, capelin and Atlantic cod. J. Northw. Atl. Fish. Sci., 22: 137–154. doi:10.2960/J.v22.a12
STRANSKY, C. 2005. Geographic variation of golden redfish (Sebastes marinus) and deep-sea redfish (S. mentella) in the North Atlantic based on otolith shape analysis. ICES J. Mar. Sci., 62: 1691–1698. doi:10.1016/j.icesjms.2005.05.012
STRANSKY, C., H. BAUMANN, S.-E. FEVOLDEN, A. HARBITZ, H. HØIE, K. H. NEDREAAS, A.-B. SALBERG, and T. H. SKARSTEIN. 2008. Separation of Norwegian coastal cod and Northeast Arctic cod by outer otolith shape analysis. Fish. Res., 90: 26–35. doi:10.1016/j.fishres.2007.09.009
STRANSKY, C., and S. E. MACLELLAN. 2005. Species separation and zoogeography of redfish and rockfish (genus Sebastes) by otolith shape analysis. Can. J. Fish. Aquat. Sci., 62: 2265–2276. doi:10.1139/f05-143
TEISSIER, G. 1960. Relative growth. In: T. H. Waterman, (ed.). The Physiology of Crustacea. Academic Press, New York, p. 537–560.
TEMPLEMAN, W., and H. J. SQUIRES. 1956. Relationship of otolith and weights in the haddock Melanogrammus aeglefinus (L.) to the rate of growth of the fish. J. Fish. Res. Board Can., 13: 467–487.
VENABLES, W. N., and B. D. RIPLEY. 1996. Modern Applied Statistics with S-plus. Statistics and computing, Springer-Verlag, New York Inc., Corrected third printing, p. 315–328.
VIKINGSON, G. A., and F. O. KAPEL. (Eds.). 2000. Minke whales, harp and hooded seals: major predators in the North Atlantic ecosystem. NAMMCO Scientific Publications, Vol. 2, ISBN 8291578060.
VLADYKOV, V. D. 1945. Trois poisons nuveaux pour La Province de Quebec. Nat. Can. Quebec, 72(1–2): 27–39.
WILLAMS, T., and B. C. BEDFORD. 1974. The use of otoliths for age determination. In: T. B. Bagenal (ed.). The Ageing of Fish. Gresham Press, Old Woking, England, p. 114–123.
2
|