Introduction
Atlantic bluefin tuna (Thunnus thynnus) are a top predator in neretic and pelagic ecosystems of the North Atlantic as well as a valuable catch for commercial and recreational fisheries. The species is widespread and in recent years it has been found in the Western Atlantic from Newfoundland and Labrador in the north to Gulf of Mexico in the south (ICCAT, 2011). Archival and satellite tag data indicate that Atlantic bluefin tuna from both western and eastern Atlantic populations migrate to Canadian waters (Block et al., 2005; Galuardi et al., 2010; Lawson et al., 2010; Wilson et al., 2011) in order to take advantage of rich summer foraging grounds (Walli et al., 2009). Of the fish that travel to Canada, the majority are large, mature individuals weighing over 150 kg (Neilson et al., 2009). The Atlantic bluefin tuna's capacity to warm muscle, viscera, and brain tissues, along with cardiac specializations (Landeira-Fernandez et al., 2011), increases its performance as a predator in cool temperatures (Carey and Teal, 1969; Graham and Dickson, 2004) and may have evolved to facilitate niche expansion into cooler northern waters (Block et al., 1993).
Diet studies provide insight into the food preferences of the Atlantic bluefin tuna. Stomach content analyses (SCA) performed on catches in the Mid Atlantic Bight (Eggleston and Bochenek, 1990; Butler et al., 2010; Logan et al., 2011), the Gulf of Maine (Chase, 2002), and Newfoundland (Butler, 1971) indicate that Atlantic bluefin tuna feed preferentially on pelagic schooling fish and opportunistically on other species. Similar diet content data are not yet available for waters off Nova Scotia and Prince Edward Island. In this study, the stomach contents of Atlantic bluefin tuna caught by the Canadian commercial fishery in the Gulf of St. Lawrence (GSL) and landed in Port Hood and caught on the Scotian Shelf and landed in Canso were analysed in order to quantify diet composition in these key foraging regions.
Methods
Atlantic bluefin tuna stomachs were collected from the 2010 commercial rod and reel fishery. The samples from the GSL were collected in Port Hood (Fig. 1), Nova Scotia, between 27 September, 2010 and 5 October, 2010. The samples from the eastern Scotian Shelf were collected in Canso (Fig. 1), Nova Scotia, between 15 September, 2010 and 20 November, 2010. Port staff recorded the date and time of capture, geographic coordinates of the capture location, type of bait, curved fork length (CFL), weight of the entire fish (RW), weight after gutting the fish (DW), and sex. A least squares linear regression was created using the 24 pairs of DW and RW data collected in this study (RW = (1.2374*DW) + 7.0754; r2 = 0.98) and used to calculate the RW of sampled fish for which DW was available but RW was not. Weight and CFL were compared using the one-tailed Mann-Whitney test. Stomachs were removed from the fish at sea in Canso and once they reached the ice house in Port Hood. The samples were frozen and analyzed at a later date.
|
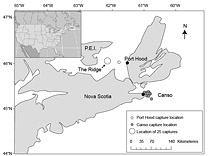 Fig. 1. Reported Atlantic bluefin tuna capture locations (n = 43) and sampling locations (black circles). Capture locations were not reported for 14 samples collected in Canso and 9 samples collected in Port Hood. Fig. 1. Reported Atlantic bluefin tuna capture locations (n = 43) and sampling locations (black circles). Capture locations were not reported for 14 samples collected in Canso and 9 samples collected in Port Hood.
|
Stomach contents were thawed and rinsed with fresh water. Prey items were identified to the lowest possible taxon and were weighed together and separately to the nearest 0.1g. A prey that could not be identified was recorded as unidentified. Bait items were identified by their cut marks and these were not included in the quantitative analysis. For each sampling port, stomach contents were described by prey-specific percent weight (%W), which was calculated as the total weight of each taxon divided by the total weight of all stomach contents. Stomach contents were also described as prey-specific frequency of occurrence (%O) for each port, which was calculated as the number of stomachs in which a taxon occurred divided by the total number of stomachs with contents. Only stomachs containing prey were included in the analyses. The diets at both locations were compared using principal components analysis (PCA) on the normalized %O data as proposed by De Crespin de Billy et al. (2000) using R (version 2.11.1, The R Foundation for Statistical Computing). Prey %O was plotted against prey-specific %W (Pi) to examine prey dominance, individual and population-wide niche widths, and feeding strategies at both locations, as described by Amundsen et al. (1996).
Prey species were grouped by family and cumulative prey curves (CPCs) were created a posteriori to determine whether the sample sizes were sufficiently large to be used to describe prey abundance in both port locations. The CPCs were built by randomly resampling the stomachs 1000 times (Bizzarro et al., 2007) and plotting the mean cumulative number of identified taxa against the number of stomachs sampled (Ferry and Cailliet, 1996). CPCs were created using Matlab (Student version 2010a, The MathWorks, Inc., Natick, MA). The Student's t-test was used to determine if the slope of the least-squares linear regression of the final four stomachs sampled was significantly different from zero. If the slope was not significantly different from zero sample size was considered adequate.
Results
A total of 68 stomachs were collected from the commercial fishery; 33 were collected in Canso and 35 in Port Hood. All fish for which geographic coordinates were provided were caught within approximately 68 km of the sampling port locations (Fig. 1). In Port Hood, 25 of the stomachs were collected from an underwater feature called "The Ridge" (Fig. 1). The mean (± 1s.d.) CFL of all fish collected from Port Hood was 265 ± 22 cm (n = 35) with a mean RW of 340 ± 68 kg (n = 35). The mean RW for Port Hood includes two sample weights estimated from DW using the regression generated from this study's data. The mean CFL of fish sampled in Canso was 144 ± 37 cm (n = 23) and the mean RW was 170 ± 87 kg (n = 31), including 17 values estimated from DW. Most fish greater than 250 kg RW were sampled in Port Hood, whereas most fish less than 250 kg were sampled in Canso (Fig. 2). Both RW and CFL differed significantly between sites (α = 0.05; p < 0.001).
|
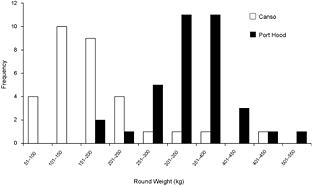
Fig. 2. The frequency of round weights (RW) of Atlantic bluefin tuna (Thunnus thynnus), in kilograms, sampled in Port Hood (n = 35) and Canso (n = 31), Nova Scotia, during Autumn, 2010. The data includes two values for Port Hood and 17 values for Canso estimated from dressed weight (DW) using the regression generated from this study's data (RW = (1.2374*DW) + 7.0754; r2 = 0.98).
|
Thirty-one (94%) of the stomachs from Canso and 23 (66%) of the stomachs from Port Hood had contents. There were significantly more empty stomachs collected in Port Hood than in Canso (χ2, p = 0.01). A total of 1564 prey items were found; 707 from Canso and 857 from Port Hood. The prey items identified included eleven families of teleosts, consisting of at least twelve species; four families of crustaceans, consisting of at least five species, all of which were found only in Canso samples; two species of bivalve (Mytilus edulis and Tellinidae sp.); cephalopods (likely Illex illecebrosus and/or Loligo pealeii); brown algae (Phaeophyceae sp.); and one starfish (Leptasterias tenera) (Table 1). Teleosts dominated the stomach contents in both sampling locations. In the stomachs sampled from Canso, unidentified teleosts occurred most frequently (Fig. 3) and constituted the greatest proportion of prey weight (Fig. 4). The second most important prey item in Canso, both by %O and %W, was herring (Clupea harengus), followed by mackerel (Scomber scombrus). Of the stomachs sampled at Port Hood, herring was the most important both by %O (Fig. 3) and %W (Fig. 4), followed by unidentified teleosts and mackerel. Unidentified squid occurred in 19% of all stomachs combined, but because their remains consisted exclusively of beaks and pens, their contribution to %W was negligible. Gadid otoliths were moderately frequent in the samples from Canso, but contributed little to %W.
Northern shrimp (Pandalus borealis) also appeared with regularity in the Canso samples, but contributed little to prey biomass. Crustaceans were absent from the samples collected in Port Hood. Notably, the hyperiid amphipod species Themisto libellula and a fish from the family Balistidae were also identified in samples from Canso.
In the combined data from both sampling sites, unidentified teleosts occurred 29% more frequently (Fig. 3) and their %W was 16% greater (Fig. 4) in the stomachs of small tuna (<220 kg RW, n = 26) than large tuna (>220 kg RW, n = 27). Conversely, herring occurred 13% more frequently (Fig. 3) and their %W was 26% greater (Fig. 4) in large tunas than in small tunas.
|
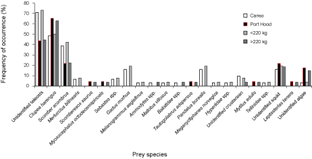
Fig. 3. Percent frequency of occurrence of prey items in Atlantic bluefin tuna (Thunnus thynnus) stomachs grouped by sample port, Port Hood (n = 23) and Canso (n = 31), and by size, <220 kg round weight (RW) (n = 26) and >220 kg (n = 27). Samples were collected during Autumn, 2010. The weight classes include 19 values estimated from dressed weight (DW) using the regression generated from this study's data (RW = (1.2374*DW) + 7.0754; r2 = 0.98).
|
The CPC for Canso reached an asymptote (p = 0.05, n = 31) (Fig. 5). Neither the CPC for Port Hood nor for the combined data reached an asymptote (Port Hood: p = 0.02, n = 23; combined samples for both ports: p = 0.01, n = 54).
In the plot of frequency of occurrence against Pi (Fig. 6), the data points are distributed in a line from the bottom left to the top right of the plot. The points for herring (Cl), mackerel (Sc), and unidentified teleosts (UF) are clustered in the top right, whereas most other species cluster to the bottom left. Both trends are more pronounced in Canso. The distribution of the points in the plot indicates that the Atlantic bluefin tuna in both sites have dominant prey, herring and mackerel, but also demonstrate generalized feeding on a number of rare species.
|
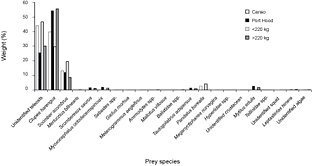
Fig. 4. Percent weight of Atlantic bluefin tuna prey items in Atlantic bluefin tuna (Thunnus thynnus) stomachs grouped by sample port, Port Hood (n = 23) and Canso (n = 31), and by size, <220 kg round weight (n = 26) and >220 kg (n = 27). Samples were collected during Autumn, 2010. The weight classes include 19 values estimated from dressed weight (DW) using the regression generated from this study's data (RW = (1.2374*DW) + 7.0754; r2 = 0.98).
|
The first three principal components were plotted and explained 39%, 19%, and 15% of the variance, respectively (Fig. 7). The observations from each sampling location did not cluster noticeably along any of the axes. Seven species appeared only in the samples from Port Hood and twelve occurred only in the samples from Canso but these occurrences were rare (Fig. 4, Table 1).
Discussion
The results above are consistent with the findings of other feeding studies on Atlantic bluefin tuna diet in the North Atlantic (Dragovich, 1970; Butler, 1971; Eggleston and Bochenek, 1990; Chase, 2002; Butler et al., 2010) which characterize Atlantic bluefin tuna as opportunistic, non-specialized predators that feed primarily on schooling teleosts. The presence of demersal prey species in the stomach contents indicates that Atlantic bluefin tuna are foraging not only on pelagic prey above the thermocline, but also on bottom dwelling species. The feeding on demersal species occurred in the GSL despite strong thermal stratification which would often expose the Atlantic bluefin tuna to extremely cold temperatures.
Given the slopes of the last three values of the CPCs for Canso and Port Hood, one can assume that the sample size was adequate to describe the diet of those fish caught in Canso, but too small to fully describe the diet of Atlantic bluefin tuna in the region Port Hood or for the combined data (Fig. 5). Nevertheless, the two datasets represent the only data for these two regions and may reasonably be used for an initial description of Atlantic bluefin tuna diet in these places.
|
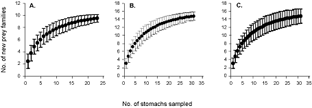
Fig. 5. Cumulative prey curves and standard deviations for Atlantic bluefin tuna (Thunnus thynnus) stomach samples collected in (A) Port Hood, Nova Scotia (n = 23), (B) Canso, Nova Scotia (n = 31), and (C) the two ports combined (n = 54), were created using 1000 randomly sampled iterations. The least squares regression of the last four samples of the CPC for Canso reached an asymptote (p = 0.05). The CPCs for Port Hood and the combined did not reach an asymptote (Port Hood: p = 0.02; combined samples for both ports: p = 0.01).
|
The overall distribution of the data points on the plot of frequency of occurrence against Pi (Fig. 6) from the bottom left to the top right indicates that Atlantic bluefin tuna at both sites display varying degrees of specialization in feeding strategies between individuals, but that few are either extreme specialists or generalists. This plot is useful for displaying the relationship between occurrence and amount. Without data on the relative abundance of prey species in the sampling locations it is not possible to determine whether diet composition is a reflection of prey species availability, feeding strategy, or a combination of the two. A comparison between prey abundance and Atlantic bluefin tuna diet composition at the capture sites is recommended for future investigation.
|
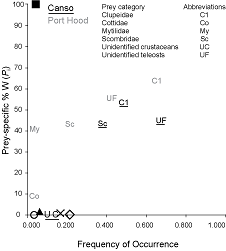
Fig. 6. The relationship between frequency of occurrence and prey species-specific percent weight for the diets of Atlantic bluefin tuna sampled in Port Hood (n = 23) and Canso (n = 31), Nova Scotia. Overlapping prey data were represented by symbols. The black square represents Scomberesocidae and Asteroidea in Port Hood and Balistidae in Canso; the white circle represents Hyperiidae, Osmeridae, Ammodytidae, Euphausiidae, Tellinidae, and algae in Canso; the black triangle represents Merlucciidae and Sebastidae in Canso; the x represents algae in Port Hood and Pandalidae in Canso; and the white diamond represents unidentified squid in Port Hood and Gadidae in Canso.
|
In the PCA (Fig. 7) the absence of clustering along any of the axes indicates that the main constituents of the diets of the fish at both locations were similar. Larger sample sizes would have a better representation of the frequency of occurrence of these rare species and would produce a more reliable PCA.
Stomach content analysis yields a detailed description of a population's diet at a point in time (Hyslop, 1980) and may also reflect local prey species community composition and abundance (Overholtz et al., 2000; Chase, 2002; Link and Garrison, 2002). Yet, despite its convenience in quantifying diet, there are a number of biases inherent to SCA. The rapid digestion rate by Atlantic bluefin tuna as a result of the warming of visceral tissues (Carey et al., 1984); differential rates of digestion among food items (Hyslop, 1980; Olson and Boggs, 1986; Chase, 2002); and proneness to regurgitation during capture (Rooker et al., 2007) are all problems that likely played a role in biasing the results. Further, as stomachs were collected by commercial fishers, temporal fishing patterns (choosing to fish at dawn versus dusk), fishing quotas, the use of preferred fishing grounds, and capture methods introduce sampling bias (Hyslop, 1980).
|
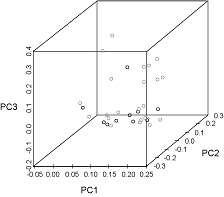 Fig. 7. Principal components (PC) analysis plot of normalized percent frequency of occurrence of prey families in the stomachs of Atlantic bluefin tuna caught in Canso (grey circles) and Port Hood (black circles). The first three principal components explain 39%, 19%, and 15% of the variance, respectively. Fig. 7. Principal components (PC) analysis plot of normalized percent frequency of occurrence of prey families in the stomachs of Atlantic bluefin tuna caught in Canso (grey circles) and Port Hood (black circles). The first three principal components explain 39%, 19%, and 15% of the variance, respectively.
|
The causes of the different proportions of empty stomachs at both sampling sites are unclear. Variability in the availability of prey at the time of capture at the fishing sights is unknown and may have affected the proportions of empty stomachs. Different capture methods at each sample site may also have contributed to the occurrence of empty stomachs. Some fishermen that land their catch at Port Hood are known to pump water into the stomach in an attempt to cool the fish more quickly and may have inadvertently flushed out the contents. There is also anecdotal evidence that fish with a longer fight time may be more likely to regurgitate during that time (D. Cameron, Ceilidh Fishermen's Co-op, 158 Main St., Port Hood, Nova Scotia, B0E 2W0, pers. comm.); however, the authors observed few distended stomachs, which suggests that regurgitation was rare. Although the number of empty stomachs is significantly larger in Port Hood, the sample size is relatively small, as indicated by the CPC analyses, and this difference may simply have been a random occurrence.
The extent to which the findings of this study represent the diet of Atlantic bluefin tuna in these regions may also be limited because sampling was only performed in the fall season of one year. Atlantic bluefin tuna diets can vary greatly between years (Chase, 2002; Overholtz, 2006) and seasons (Butler, 1971). Temperature characteristics in the GSL are known to vary between years and may cause changes in prey availability and Atlantic bluefin tuna distribution (Vanderlaan et al., 2011). Prey availability also varies throughout the year, as is well documented in the GSL. Mackerel arrive in the GSL in late May and early June (Sette, 1950; D'Amours and Castonguay, 1992) and remain until October (McKay, 1979), whereas herring congregate to spawn in the spring, before the Atlantic bluefin tuna have arrived, and in the fall from August to the end of September (Messieh, 1987). The presence of gravid herring in the samples from Port Hood confirms that the Atlantic bluefin tuna in the GSL were feeding on the aggregations of fall spawners during sampling. It is likely that the Atlantic bluefin tuna arrive in the GSL in late June and July (Wilson et al., 2011) to feed on mackerel and switch to the more plentiful herring later in the summer. For this reason, sampling late in the season may also bias the stomach content results.
The presence of the remains of a balistid in one stomach is surprising, as these are warn-water species. Fish from the family Balistidae and the related Monacanthidae have been reported occasionally in the waters off of Nova Scotia (Scott and Scott, 1988). These occurrences are likely associated with the approach of warm water masses from the Gulf Stream. Sea-surface temperature satellite images indicate that neither the Gulf Stream nor warm-core rings were within 200 km of Canso during the month prior to the capture of the tuna, making the presence of balistids and monacanthids unlikely. It is possible that the tuna had consumed this fish while in the Gulf Stream and the large bones may have resisted digestion and/or expulsion and remained in the stomach as the tuna traveled north. The bones were large and worn, lending credence to the later explanation.
There appear to be differences in diet between the Atlantic bluefin tuna sampled at each location, although these differences were not statistically significant. The factors contributing to these variations are difficult to determine as Atlantic bluefin tuna size and location are closely correlated in the data. The differences in diet between sampling locations are primarily the occurrences of rare prey. The majority of the Atlantic bluefin tuna caught in the GSL were larger than those caught in Canso, with few exceptions (Fig. 2), making it difficult to determine how location and predator size each affect diet. Previous studies provide mixed results as to the relationship between Atlantic bluefin tuna size, prey size, and prey composition, but most authors agree that the relationship is weak (Dragovich, 1970; Young et al., 1997; Chase, 2002; Butler et al., 2010). Given the results of these previous studies, it is likely that capture location had a greater effect on diet then the predator size. Catch data (Neilson et al., 2009) also indicates that larger Atlantic bluefin tuna are foraging in the GSL versus the Scotian Shelf, which raises the question as to why primarily large Atlantic bluefin tuna are found in these waters. It may be that the migration patterns of large individuals are different from smaller individuals and that these large tuna are likely undertaking the migration from the Scotian Shelf to the GSL in order to take advantage of better foraging opportunities.
The results of this study of Atlantic bluefin tuna diet in the GSL and the Scotian Shelf are consistent with other feeding studies in the North Atlantic, which indicate that these fish feed primarily on schooling fish of lower trophic levels and opportunistically on other species. Although the Atlantic bluefin tuna landed in Port Hood were significantly larger than those landed in Canso, the diets at both sites were similar. It would be of interest to determine whether densities of prey and/or the nutritional qualities of prey, such as fat content, are greater in the GSL. Additional sampling years and larger sample sizes are recommended to produce more reliable descriptions of Atlantic bluefin tuna feeding ecology in the sampling areas.
Acknowledgements
I owe my thanks to Duncan Sutherland, Gordon (Buzz) Roberts, and Cpt. Dennis Cameron for help collecting samples. I would also like to thank Dr. Alan Pinder, Chris Butler, Warren Joyce, Anna Dorey, and Brad Chase for their contributions. This project was supported by the Tag-A-Giant Foundation
References
Amundsen, P.-A., H.-M. Gabler and F. J. Staldvik. 1996. A new approach to graphical analysis of feeding strategy from stomach contents data – modification of the Costello (1990) method. J. Fish Biol., 48: 607–614. http://dx.doi.org/10.1006/jfbi.1996.0060. http://dx.doi.org/10.1111/j.1095-8649.1996.tb01455.x
Bizzarro, J. J., H. J. Robinson, C. S. Rinewalt and D. A. Ebert. 2007. Comparative feeding ecology of four sympatric skate species off central California, USA. Env. Biol. Fish., 80: 197–220. http://dx.doi.org/10.1007/s10641-007-9241-6
Block, B. A., J. Finnerty, A. F. R. Stewart and J. A. Kidd. 1993 Evolution of endothermy in fish: mapping physiological traits on a molecular phylogeny. Science, 260: 210–214.
Block, B. A., S. L. H. Teo, A. Walli, A. Boustany, M. J. W. Stokesbury, C. J. FaRWell, K. C. Weng, H. Dewar and T. D. Williams. 2005. Electronic tagging and population structure of Atlantic Bluefin Tuna. Nature, 434: 1121–1127. http://dx.doi.org/10.1038/nature03463
PMid:15858572
Butler, M. J. A. 1971. Biological investigations on aspects of the life history of the bluefin tuna, 1970–1971. Newfoundland and Labrador Tourism Development Office, Canada, 169 p.
Butler, C. M., P. J. Rudershausen and J. A. Buckel, 2010. Feeding ecology of Atlantic bluefin tuna (Thunnus thynnus) in North Carolina: diet, daily ration, and consumption of Atlantic menhaden (Brevoortia tyrannus). Fish. Bull., 108: 56–69.
Carey, F. G. and J. M Teal. 1969. Regulation of body temperature by bluefin tuna. Comp. Biochem. Physiol., 28: 205–213. http://dx.doi.org/10.1016/0010-406X(69)91336-X
Carey, F. G., J. W. Kanwisherand E. D. Stevens. 1984. Bluefin tuna warm their viscera during digestion. J. Exp. Biol. 109: 1–20.
Chase, B. C. 2002. Differences in diet of Atlantic bluefin tuna (Thunnus thynnus) at five seasonal feeding grounds on the New England continental shelf. Fish. Bull., 100: 168–180.
Collette, B. B. and C. E. Nauen. 1983. FAO Species Catalogue. Vol. 2. Scombrids of the world. An annotated and illustrated catalogue of tunas, mackerels, bonitos and related species known to date. FAO Fish.Synop., 2: 91.
Committee On the Status of Endangered Wildlife In Canada (COSEWIC). 2011. COSEWIC assessment and status report in the Atlantic bluefin tuna Thunnus thynnus in Canada. Committee on the Status of Endangered Wildlife in Canada, Ottawa, 2011. 30 pp.
D'AMOURS, D. and M. CASTONGUAY. 1992. Spring migration of Atlantic mackerel, Scomber scombrus, in relation to water temperature through Cabot Strait (Gulf of St. Lawrence). Enviro. Biol. Fishes, 34: 393–399. http://dx.doi.org/10.1007/BF00004743
De Crespin de Billy, V., S. Doledec and D. Chessel. 2000. Biplot presentation of diet composition data: an alternative for fish stomach contents analysis. J. Fish Biol., 56: 961–973. http://dx.doi.org/10.1111/j.1095-8649.2000.tb00885.x
DFO, 2010. 2009 Value of Atlantic Coast Commercial Landings, by Region. http://www.dfo-mpo.gc.ca/stats/commercial/land-debarq/sea-maritimes/s2009av-eng.htm
Dragovich, A. 1970. The food of bluefin tuna (Thunnus thynnus) in the Western North Atlantic Ocean. T. Am. Fish. Soc., 99: 726–731. http://dx.doi.org/10.1577/1548-8659(1970)99<726:TFOBTT>2.0.CO;2
Eggleston, D. B. and E. A. Bochenek. 1990. Stomach contents and parasite infestation of school bluefin tuna Thunnus thynnus collected from the Middle Atlantic Bight, Virginia. Fish. Bull., 88: 389–395.
Ferry, L. A. and G. M. Cailliet. 1996. Sample size and data: Are we characterizing and comparing diet properly? In: Feeding ecology and nutrition in fish; proceedings of the symposium on feeding ecology and nutrition in fish; Int. Congress Biology of Fishes. D. Makinlay and K. Shearer, (eds.), p. 70–81. American Fisheries Society, San Francisco, CA.
Galuardi, B., F. Royer, W. Golet, J. Logan, J. Neilson and M. Lutcavage. 2010. Complex migration routes of Atlantic bluefin tuna question current population structure paradigm. Can. J. Fish. Aquat. Sci., 67: 966–976. http://dx.doi.org/10.1139/F10-033
Graham, J. B. and Dickson, K. A. 2004. Evolution and consequences of endothermy in fishes. Physiol. Biochem. Zool., 77: 998–1018. http://dx.doi.org/10.1086/423743
PMid:15674772
Hyslop, E. J. 1980. Stomach contents analysis – a review of methods and their application. J. Fish Biol., 17: 411–429. http://dx.doi.org/10.1111/j.1095-8649.1980.tb02775.x
ICCAT (International Commission for the Conservation of Atlantic Tunas). Report of the Standing Committee on Research and Statistics 2010–2011. Madrid: 2011.
Landeira-Fernandez, A. M., P. C. Castilho and B. A. Block. 2012. Thermal dependence of cardiac SR Ca2+-ATPase from fish and mammals. J. Therm. Biol., 37: 217–223. http://dx.doi.org/10.1016/j.jtherbio.2012.01.003
Lawson, G. L., M. R. Castleton and B. A. Block. 2010. Movements and diving behavior of Atlantic bluefin tuna (Thunnus thynnus) in relation to water column structure in the Northwestern Atlantic. Mar. Ecol. Prog. Ser., 400: 245–265. http://dx.doi.org/10.3354/meps08394
Logan, J. M., E. Rodriguez-Marín, N. Goñi, H. Arrizabalaga, W. Golet and M. E. Lutcavage. 2011. Diet of young Atlantic bluefin tuna (Thunnus thynnus) in eastern and western Atlantic foraging grounds. Mar. Biol., 158: 73–85.
MacKAY, K. T. 1979. Synopsis of biological data of the northern population Atlantic mackerel (Scomber scombrus). Fish. Mar. Serv. Tech. Rep., 885. http://dx.doi.org/10.1007/s00227-010-1543-0. http://dx.doi.org/10.1007/s00227-011-1758-8
MESSIEH, S. N. 1987. Some characteristics of Atlantic herring (Clupea harengus) spawning in the Southern Gulf of St. Lawrence. NAFO Sci. Coun. Studies, 11: 53–61.
NRC (National Research Council). 1994. An Assessment of Atlantic Bluefin Tuna. National Academy Press, Washington DC.
Neilson, J. D., S. Smith, M. Ortiz and B. Lester. 2009. Indices of stock status obtained from the Canadian bluefin tuna fishery. Collect. Vol. Sci. Pap. ICCAT, 64: 380–404.
Olson, R. J. and C. H. Boggs. 1986. Apex predation by yellowfin tuna (Thunnus albacares): independent estimates from gastric evacuation and stomach contents, bioenergetics, and cesium concentrations. Can. J. Fish. Aquat. Sci., 43: 1760–1775. http://dx.doi.org/10.1139/f86-220
Overholtz, W. J. 2006. Estimates of consumption of Atlantic herring (Clupea harengus) by bluefin tuna (Thunnus thynnus) during 1970–2002: an approach incorporating uncertainty. J. Northwest Atl. Fish. Sci., 36: 55–63. http://dx.doi.org/10.2960/J.v36.m572
Overholtz, W. J., J. S. Link and L. E. Suslowicz. 2000. Consumption of important pelagic fish and squid by predatory fish in the northeastern USA shelf ecosystem with some fishery comparisons. ICES J. Mar. Sci., 57: 1147–1159. http://dx.doi.org/10.1006/jmsc.2000.0802
Rooker, J. R., J. R. Alvarado Bremer, B. A. Block, H. Dewar, G. De Metrio, A. Corriero, R. T. Kraus, E. D. Prince, E. Rodrígues-Marín and D. H. Secor. 2007. Life history and stock structure of Atlantic bluefin tuna (Thunnus thynnus). Rev. Fish. Sci., 15: 265–310. http://dx.doi.org/10.1080/10641260701484135
SETTE, O. E. 1950. Biology of the Atlantic mackerel (Scomber scombrus) of North America. Part 2: Migrations and habits. U. S. Fish. Bull., 51: 251 –358.
Scott, W. B. and M. G. Scott. 1988. Atlantic Fishes of Canada. Can. Bull. Fish. Aquat. Sci., 219: 562–564.
Vanderlaan, A. S. M., B. A. Block, J. Chassé, M. E. Lutcavage, A. Hanke, S. G. Wilson and J. D. Neilson. 2011. Initial investigations of environmental influences on Atlantic bluefin tuna catch rates in the Southern Gulf of St. Laurence. Collect. Vol. Sci. Pap. ICCAT, 66: 1204–1215.
Walli, A., H. Teo, A. Boustany, C. J. FaRWell, T. Williams, H. Dewar, E. Prince and B. A. Block. 2009. Seasonal movements, aggregations and diving behaviour of Atlantic bluefin tuna (Thunnus thynnus) revealed with archival tags. PLoS ONE 4:e6151. http://dx.doi.org/10.1371/journal.pone.0006151
Wilson, S. G., G. L. Lawson, M. J. W. Stokesbury, A. Spares, A. M. Boustany, J. D. Neilson and B. A. Block. 2011. Movements of Atlantic bluefin tuna from the Gulf of St. Lawrence to their spawning grounds. Collect. Vol. Sci. Pap. ICCAT, 66: 1247–1256.
YOUNG, J. W., T. D. LAMB, D. LE, R. W. BRADFORD and A. W. WHITELAW. 1997. Feeding ecology and interannual variations in diet of southern bluefin tuna Thunnus maccoyii, in relation to coastal and oceanic waters off eastern Tasmania, Australia. Environ. Biol. Fishes, 50: 275–291.
|