Introduction
In the early 1990s, interest by the Canadian fishing industry in developing fisheries for new species in deep water provided an opportunity for a joint Industry - Government venture to explore the commercial potential of fish resources on the Scotian Shelf slope, south of Nova Scotia. The only previous survey of the demersal fish fauna in this area had been conducted by a research vessel, and sampling was restricted to depths shallower than 1 200 m (Markle et al., 1988). The presently reported surveys were conducted by a commercial fishing trawler in November 1994 and in March 1995, at bottom depths of 910–1 830 m. This paper reports on the fish catches made during these surveys, examines patterns in species distributions, and compares results with those of Markle et al. (1988), and with those from other studies in adjacent geographical areas.
An account of catches of pelagic fish species made during these 1994–95 surveys is provided also. Markle et al. (1988) did not include pelagic fish catches in their report, but their records were available to the authors of the present study and are provided here for comparison with 1994–95 catches.
Methods
The surveys were conducted by the commercial fishing trawler Cape Chidley (length – 43 m; tonnage – 792; horsepower – 2 400) on 6–16 November 1994 and 7–16 March 1995 (labelled C19 and C20 respectively). A commercial Engel high-lift bottom trawl was used with 1 500 kg polyvalent trawl doors and a 51.8 m footrope equipped with 53 and 61 cm disc rock-hopper foot gear. Netting was of regulation 145 mm mesh but a 30 mm small mesh liner was inserted in the belly extension and codend to retain small specimens and a 20 mm diameter tickler chain was attached ahead of the footrope to enhance capture of bottom dwelling fauna. A headline transducer was deployed on all tows to measure vertical opening of the net. Headline height was typically about 6 m and no marked differences were observed between surveys or among depth zones. No instrumentation was available to measure horizontal net opening but, according to the vessel owners, previous performance data for this net (in shallower waters) indicated that the normal spread from wingtip to wingtip was 24 m and between the trawl doors was 69 m.
Sampling was stratified by area and depth, and fishing locations within strata were chosen randomly. On the first survey (C19), four discrete areas were fished. These were located south of Browns, LaHave, Western and Banquereau banks (Fig 1, top panel). During the second survey (C20), four larger, contiguous, areas located south of Browns, LaHave, Emerald and Western - Sable Island banks were fished (Fig.1, bottom panel). Each fishing area was divided into five depth strata at 100 fm (183 m) intervals, but for presentation of data, stratum boundaries are defined in metres (rounded to the nearest 10 m). Fishing was conducted on a 24 hr. basis, and stations were occupied in the order that minimized transit time.
|
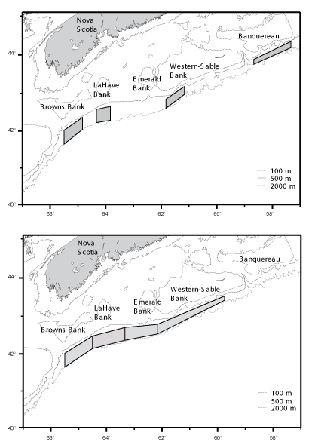
Fig. 1. Areas fished by the Cape Chidley: top panel – C19, November 1994, bottom panel – C20, March 1995
|
The vessel's standard fishing procedure was to tow the net at 3.0 knots for one hr., measured from completion of shooting to start of haul back. However, there was insufficient trawl warp to maintain the same scope for deeper as for shallower tows and towing speed had to be reduced to 2.5 knots for the two deepest strata to get the net on bottom. Also, the actual start of trawling was taken as the time that resistance was felt due to bottom contact and it was found that actual time on bottom varied from 51 min. in the shallowest, to 46 min. in the deepest, stratum. Thus, distance towed was about 2.5 nautical miles for tows in the three shallowest strata, but the lower towing speed and reduced time on bottom for tows in the deeper strata resulted in the distance towed in the 1 460–1 650 m stratum being about 0.80, and in the 1 650–1 830 m stratum being about 0.75, of that in the shallower strata. Thus, abundance estimates for these deep strata were adjusted by x1.25 and x1.33 respectively.
The at-sea scientific protocol was to obtain the weight, number and length frequency (total length to the nearest cm) of each taxon in every catch. Particularly large catches of a taxon were sub-sampled by weight, numbers and length compositions subsequently being adjusted by the ratio of total to sample weight. Species that occurred in high volume were either retained by the vessel for commercial purposes or discarded, with scientific personnel retaining voucher specimens. In addition, a miscellany of taxa that occurred rarely, or that were recognized as presenting identification difficulties, was retained. All kept specimens were identified subsequently by the authors and the at-sea records were edited based on these laboratory results. In the majority of cases, voucher specimens confirmed at-sea species identifications but, in some, the taxonomic situation proved more complex than initially recognized at sea. In the latter circumstance, the authors reassigned taxonomic designations at the species level when the evidence was convincing but to higher taxonomic levels in the other cases. All retained specimens were deposited at the Atlantic Reference Centre (ARC), Huntsman Marine Science Centre (HMSC), St. Andrews, New Brunswick, Canada. Taxonomy follows Eschmeyer and Fricke (2012).
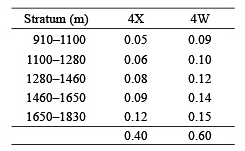
Comparisons of catches between areas, depths and surveys were restricted to those tows that were considered 'problem free'. Problematic tows were defined as those during which severe damage to the net occurred, when tow time was substantially reduced due to hang-ups on bottom obstacles, or when catches contained atypically low numbers of demersal species, indicating that the net was fishing off bottom. Species compositions were compared among stations using Bray-Curtis similarity coefficients following fourth root transformation of abundance data. Samples were partitioned using the CLUSTER routine in PRIMER version six (Clarke and Gorley, 2006). Length frequencies (by 3 cm groups) and mean lengths were calculated for the five species that contributed most to catches (by weight) by combining numbers per tow at length within each depth zone for two areas, Northwest Atlantic Fisheries Organization (NAFO) Divisions 4X (Browns -LaHave sampling areas) and 4W (Emerald-Western-Sable banks sampling areas). Estimates of the area of bottom within each depth/NAFO Division category (DFO: unpublished) were then used to obtain the following depth strata/Division weightings for amalgamation of the data from each survey:
 Distributional records in the primary literature were used to determine which species in the present collections had not previously been reported from the study area. Online sources based on shared, disparate data collections were utilized only when records of interest could be verified through personal communication. The assignment of taxa to demersal or pelagic categories was based on their designations by Moore et al. (2003), species listed by them as benthic or benthopelagic in habit being classed here as demersal, and others as pelagic species. Common names, in Tables 1 and 2, follow usage by presently cited authors, particularly Moore et al. (2003), but cannot be provided for all species as some do not have accepted common names. Depth categorizations, upper slope (200–750 m), mid slope (750–1 500 m) and lower slope (1 500–2 250 m), follow Haedrich and Merrett (1988). The Northwest Atlantic is equated to the NAFO Statistical Area.
Results
The surveys were largely successful in implementing a stratified-random sampling design with at least two sampling locations being fished in each depth stratum in each fishing area. Fishing areas differed between surveys, however (Fig. 1). On C19, the rate of successful completion of tows in the Banquereau area was low, only six of the 11 tows made there being classifiable as problem free, and thus this area was excluded from the sampling plan for C20. The sampling areas on C20 were contiguous and encompassed the other, discrete, areas used on C19. In these areas, 29 (of 31) tows on C19, and 44 (of 47) tows on C20, were considered problem free. It is the data from these tows that were used in analyses of geographic and bathymetric distributions, and size compositions. However, catches made in the Banquereau area on C19 are described separately and included in the listing of catches overall.
Demersal Species
Taxonomic composition
Approximately 25 metric tons (39 000 specimens) of demersal fish, belonging to at least 82 species, were caught (Tables 1 and 2). Among these, 10 taxa accounted for 90% of the catch by weight and these 10 accounted also for 80% by number. More than half the catch (by weight and number) consisted of Centroscyllium fabricii and Coryphaenoides rupestris.
For instances in Table 1 where catches are reported at a taxonomic level higher than species, the predominant species can be inferred quite reliably when voucher specimens were available (Table 2), e.g. it is likely that most of the fish listed as Rajidae NS in Table 1 were Amblyraja jenseni. Inferences about the abundance of the secondary species in a category relative to the primary species would be inappropriate, however. This is because relatively few voucher specimens were kept for abundant species, but most or all specimens of taxa recognized as 'different' were retained. Records reported in Table 1 at the family level that were not supported by voucher specimens (Alepocephalidae, Ipnopidae, Ophidiformes, Gadiformes and Zoarcidae) are mostly of little numerical importance and consist of inadequately documented records. There are, in addition, two special cases:
Apristurus spp.: Markle et al. (1988) recognized two forms in their catches but (Moore et al., 2003) listed four species as possibly occurring off New England, all of which might occur also in the present study area. See also Hartel et al. (2008).
Bathyraja spp.: while species-level identifications were recorded at sea, there was an association between identifications and surveys (two B. richardsoni on C19, two B. spinicauda on C20) that raises doubt about their reliability. Thus, the species level identifications were not accepted.
Almost 30% (23) of the species listed in Tables 1 and 2 had not been recorded previously from off Nova Scotia. Thirteen of these new records were of species documented as having ranges that include adjacent areas, primarily to the southwest off New England (Moore et al., 2003), and thus they represent only minor range extensions. The remaining 10 species are ones that previously have not been recorded, or have been recorded only rarely, from the NAFO Statistical Area, i.e. north of Cape Hatteras (35°N). Capture information, ARC catalogue numbers, and distributional notes are provided for these in Table 3.
Among the minor range extensions, it is noteworthy that the records of Rajella bathyphila are not in conformance with the convention accepted by Moore et al. (2003) that this species does not occur southwest of the Grand Banks (and thus that all records to the southwest must be of the closely-related Rajella bigelowi). More recently, Sulak et al. (2009) ignored this convention by recording R. bathyphila from the Mid-Atlantic-Bight. The latter authors are followed here, as the two specimens from off Western Bank had total lengths of 92 and 96 cm, greatly exceeding the maximum length of 50 cm that has been recorded for R. bigelowi (Sulak et al., 2009).
Geographic and bathymetric distributions
Variation with depth of the catch rate (no. and wt. per tow) of all demersal species combined showed a similar pattern in both surveys (Fig. 2), with highest values occurring in one of the two shallowest strata and lowest values in one of the two deepest strata. The average time of day that fishing occurred did not vary systematically with depth. Thus, time of sampling in relation to diurnal vertical migration patterns does not explain the observed progressive decline in catch rates in the three deepest strata in both surveys. The number of demersal taxa caught per tow did not vary with depth but was about 19 on C19 and 22 on C20. There was a broad similarity in catch rates among areas and between surveys except that, on C20, catch rates in 1 100–1 280 m and 1 280–1 460 m strata in the LaHave area were more than double those in other areas. These high catches were composed primarily of C. rupestris.
|
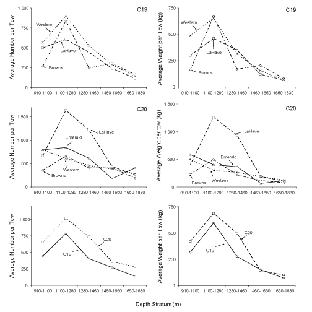
Fig. 2. Average catch rates of demersal species by number and weight for each sampling area by depth stratum for C19 (top panels) and C20 (mid-panels) and by survey overall (bottom panels). (Banquereau Bank data excluded; averages for 1 460–1 650 m and 1650–1830 m strata adjusted by x1.25 and x1.33 respectively - see text; scales for Y-axes vary.)
|
Cluster analyses based on catch numbers (Fig. 3) resulted in dendrograms showing that the depth strata were more important in ordering the stations than sampling area. For C19, three station groups formed, one containing the two tows in the shallowest stratum off Browns Bank, a second composed of the remaining tows in the three shallowest strata plus one at 1 460–1 650m off Browns Bank, and a third group composed of the remaining tows in the two deepest strata. The two shallow Browns Bank sets differed from the larger 'shallow' group (average dissimilarity = 43%) due primarily to the presence of Glyptocephalus cynoglossus and the absence of Alepocephalus agassizi and Etmopterus princeps. The average dissimilarity between the two large station groups (48%) was due particularly to higher abundance of C. fabriciiand C. rupestris in the 'shallow' strata and Halosauropsis macrochir and A. agassizi in the deeper strata. For C20, sampling was more intensive and seven groups formed but, nonetheless, there were two main groups, one containing most of the tows in the three shallow strata and another with most of the tows in the two deep strata, analogous to the two main groups in C19. The average dissimilarity between these two groups (49%) was also comparable to that observed in C19, and was due to the same species except that, in C20, Coryphaenoides spp. replaced A. agassizi in importance in the deep strata. In C20, a secondary deep group formed containing two stations that differed from the main deep group (average dissimilarity = 46%) due to low catches of Synaphobranchus kaupii and the absence of Aldrovandia spp. and Simenchelys parasitica. The three smaller clusters on the left of the dendrogram are composed largely of tows in the shallowest stratum, and differ variously from the main 'shallow' group by the presence of the upper slope species, G. cynoglossus and Phycis chesteri, and lesser abundance of mid-slope species. Thus, the patterns of species distributions described by the two surveys were in general agreement.
|
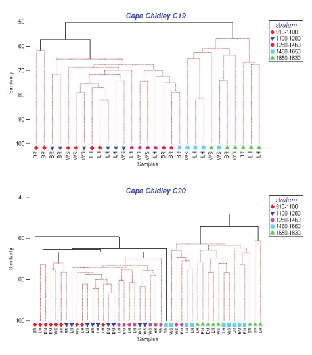
Fig. 3. Hierarchical clustering using fourth-root transformation of catch numbers for all species and stations from Cape Chidley cruises C19 (top panel) and C20 (bottom panel). (Letters indicate banks: BR- Browns; LH-LaHave; EM-Emerald; WS – Western). Symbols indicate depth strata in metres (see key on right).
|
A combined list for the two surveys of the taxa that were among the top 10 numerically within at least one depth stratum (Table 4) illustrates how the predominant species varied with depth. Centroscyllium fabricii, C. rupestris and Nezumia bairdii dominated catches in the three shallowest strata. Alepocephalus agassizii and S. kaupi were moderately abundant in all depths but rose to prominence in rankings in the two deepest strata due primarily to the much reduced abundance, at these depths, of the three species that dominated at shallower depths. The species that actually had their highest abundance in the two deepest strata were H. macrochir, Gaidropsarus ensis, Hydrolagus affinis and Rouleina attrita.
Ranking the top 10 taxa by weight rather than by number replaced four small-bodied taxa (S. parasitica, Coryphaenoides spp., Dicrolene introniger and Aldrovandia spp.) by larger-bodied ones (Centroscymnus coelolepis, Rhinochimaera atlantica, Cottunculus thompsonii and Macrourus berglax) (Table 4). This resulted in differences in rankings, particularly in a substantially higher ranking of Reinhardtius hippoglossoides, but did not materially change the perceptions based on numbers on how the fauna changed with depth.
Some of the taxa in these comparisons consisted of more than one species, distorting the results to some extent. Nothing can be added to clarify the species composition of Apristurus spp., but it is clear that the Aldrovandia spp. group was largely comprised of Aldrovandia phalacra (Table 2). The bi-modal depth distribution of Coryphaenoidesspp. presents a more complex situation. The abundance of specimens taken in the three deepest strata increased with depth, as did their mean length (12, 14 and 19 cm), and these fish were likely to have been in large part Coryphaenoides carapinus. However, of the 123 specimens caught in the shallowest stratum (mean length 25 cm), only one was kept for subsequent laboratory identification and it proved to be Coryphaenoides alateralis, a species not previously reported from the area (see Table 3). This is too weak a basis on which to make an inference about the identity of the remaining specimens in this stratum. It is clear, however, that at least two species of Coryphaenoides, with different depth distributions, were making important contributions to the present collection.
The six tows made off Banquereau Bank that were classed as problem-free were combined into two depth groups, 1 100–1 460 m and 1 460–1 830 m, for data presentation (Table 5). Alepocephalus bairdii and R. attrita were prominent components of these catches, and C. rupestris and C. fabricii were less dominant than elsewhere. However, such differences from the more western sampling areas are as likely to be due to the vagaries of sampling in this area as to differences in faunal composition.
Size compositions
Total length, the measurement used for all species on the Cape Chidley surveys, is not the preferred metric for those species with fragile tails that are easily damaged during capture, e.g. Macrouridae and Chimaeriformes, e.g. ICES (2008). However, the conclusions made here from comparisons of size compositions between surveys and depth strata are relative, and conclusions are not likely to be affected by whatever bias the use of total length may have introduced.
Area-weighted length frequencies, indicative of the length compositions of the populations available to the gear, were generally similar between surveys for the five species that contributed most, by weight, to catches (Fig. 4). For
R. hippoglossoides and Harriotta raleighana, the relative numbers by length group were almost identical between surveys. In the other three cases, C. rupestris, C. fabricii and A. agassizii, population estimates from C19 contained fewer small fish than did those from C20. The C19 estimates of large specimens of C. rupestris were lower also, and total population number was 60% of that for C20. In the cases of C. fabricii and A. agassizii, population number estimates from C19 were 85% and 70% respectively, of those from C20.
|
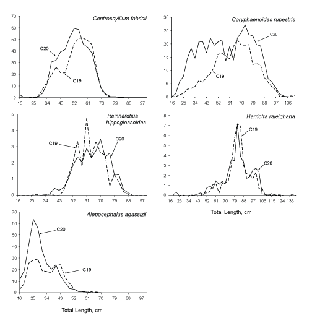
Fig. 4. Length frequencies, by survey, for the five species that contributed most to catches by weight. (Banquereau Bank data excluded; Y-axis values are weighted by stratum areas, i.e., they are relative numbers; X-axis scales vary among species.)
|
For these five species, the size of fish caught varied with depth in most cases (Fig. 5). Typically, average lengths were smallest in the shallowest tows, increasing with depth to the 1 280–1 460 m stratum or to the 1 460–1 650 m stratum. Catches in the deepest stratum suggested a levelling off in average size but catch numbers in this stratum were so few that any conclusion is speculative. The clearest example of increasing size with depth is provided by R. hippoglossoides, average lengths in 910–1 100 m being about 60 cm, increasing to about 65 cm in 1 100–1 280 m and 65–70 cm in 1 280–1 650 m, and trends for C. rupestris and A. agassizii were roughly similar in scale. In contrast, the size of C. fabricii showed only a slight tendency to increase with depth and H. raleighana showed none, average length being lowest at the middle of the depth range sampled.
|
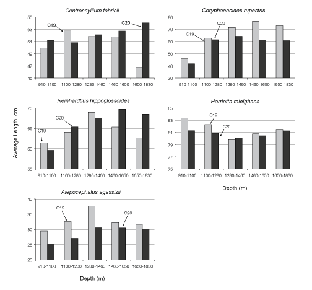
Fig. 5. Average lengths by depth stratum (m), by survey, for the five species that contributed most to catches by weight. (Banquereau Bank data excluded; note that Y-axis scales vary.)
|
Pelagic Species
The Cape Chidley bottom trawl surveys caught at least 40 taxa of pelagic fishes, consisting of approximately 1 500 specimens weighing almost 60 kg (Table 6). There were cases of catches reported at a taxonomic level higher than species for pelagic taxa also and, for a number of these, voucher specimens were available that give an indication of their species composition (Table 7). However, the data from these voucher specimens are too scant to allow inferences to be made about the relative abundance of these species in catches.
The survey reported on by Markle et al. (1988), conducted in 1984 by the government-chartered vessel, Lady Hammond, using a Western IIA bottom otter trawl, similarly caught about 40 taxa of pelagic fishes, consisting of almost 1 000 specimens (Table 8). Included in Table 8 are three species of liparid, and the trichiurid Benthodesmus tenuis, species that would be considered demersal under present criteria, but presumably were considered pelagic by Markle et al. (1988).
There was a strong similarity in the pelagic taxa caught by bottom trawl on the two surveys, about 70% being in common, despite differences in gear design and depths fished, and most of these taxa occurred also in midwater trawl samples from the same area (Themelis and Halliday, 2012), or in waters to the immediate southwest of the sampling area (Moore et al., 2003). Of note, however, is the record of Platytroctes apus (Cape Chidley, 42°45'N 61°41'W, 1 498–1 522 m, ARC 9914821), only two specimens of which have been reported previously from the NW Atlantic, one at about 40°N (Hartel et al., 2008), the other off Greenland ((Møller et al., 2010), and the record of Benthodesmus tenuis (Lady Hammond, 42°57'N 61°41'W, 558–585 m, ARC 8600838), which is only the second record north of Cape Hatteras, the first being off Browns Bank (Scott and Scott, 1988).
Discussion
The reason why the number of benthic taxa caught per tow differed between surveys, being about 15% higher on C20 than on C19, is not clear. The surveys were quasi-commercial in character, and close cooperation between ship's crew and scientific personnel was required to meet the needs of both. It is possible that this cooperation improved between surveys, explaining the higher number of taxa per tow observed on C20. It is also possible, however, that minor differences in the trawl nets, the net used on C19 being lost at sea and replaced on C20 with another built to the same specifications, contributed to this, and other, differences in results between surveys.
The much higher catches of C. rupestris in the LaHave area than in other areas on C20 occurred, in large part, in a series of tows added at the end of the sampling program. It is possible that these tows did not conform to the randomized sampling design, biasing results. Nonetheless, when these added tows are disregarded, abundance estimates for this species in the LaHave area, although reduced, remain higher than in other areas. In contrast, C19 estimates of C. rupestris in the LaHave area were not higher than elsewhere. However, sampling on C19 was restricted to non-contiguous blocks, which could have introduced bias to abundance estimates from this survey if, for example, areas of high density of C. rupestris were excluded from the sampling blocks. An association of C. rupestris with canyons, as has been noted by Snelgrove and Haedrich (1985) in data from southeastern Grand Bank and off New England, could underlie such a bias. While there is no evidence for such an association in data from the present study, differences in sampling design nonetheless may have been an important factor causing variability in quantities caught between surveys.
While areas fished differed to some extent between surveys, cluster analysis did not find area to be a factor of importance in determining species composition; rather it was depth that had an over-riding influence. Catch rates were high in the three shallowest strata (910–1 460 m) but declined to much lower levels in 1 460–1 650 m and to minima in 1 650–1 830 m on both surveys. In the present study, it was necessary to apply correction factors to catches to account for a reduction in towing speed, and hence distance towed, when fishing in the two deepest strata, but their adequacy is not known. An inference about the affects of this difference in sampling procedure with depth can be made based on catches of several large-bodied species that are perhaps the most capable of avoiding slow-moving nets. According to Moore et al. (2003), the depth distribution of H. raleighana extends to 2 452 m, that of C. coelolepis to 3 675 m, and of E. princeps to 2 213 m, but these species were caught by the Cape Chidley primarily in 910–1 460 m. This suggests that, relative to catches in these strata, catches in the two deepest strata may have underestimated abundance of these, and perhaps other, species. Nonetheless, these particular species were not among the most important in determining the dissimilarity between the two main groups and, despite the confounding effect of changes in fishing procedure with depth, present results are consistent with those of other studies which have found a distinction between mid slope and lower slope assemblages. In particular, cluster analysis of fish occurrence data from a video survey at 53°–56°W (Baker et al., 2012), immediately to the east of the present surveys, defined a boundary between species assemblages at about 1 300m, and these authors cite other such cases.
The bottom trawl survey off Nova Scotia by the Lady Hammond (Markle et al., 1988) extended from LaHave Bank to St. Pierre Bank (56°W) and thus overlapped strongly, geographically, with the Cape Chidley surveys. Depths surveyed by the Lady Hammond extended from 400 m to 1 200 m and thus catches contained many upper slope species that were not available to Cape Chidley surveys. However, in those depth strata that overlapped (strata 3+4: 800–1 200 m of Markle et al. (1988), their Table 5, versus 910–1 280 m, present data), the species predominating in catches were similar. However, in these overlapping strata, the Cape Chidley caught more than five times the number, and ten times the weight, per tow of the Lady Hammond (all taxa combined), and caught almost twice as many species per tow. The Western IIa net used by Markle et al. (1988) was smaller than the Engel trawl used by the Cape Chidley (headline height 4.6 m, wingspread 10.7 m (Carrothers, 1988) versus 6.0 m and 24 m, respectively) and nominal tow time was half as long. These factors likely account for much of the difference in catches. Also, however, the Lady Hammond was fishing at the limit of its capability at these depths, a factor that likely reduced further its fishing power relative to the Cape Chidley.
The video survey of Baker et al. (2012) of the fish fauna in canyons off SW Newfoundland in 350–2 250 m provided a list of species observed that was very similar to the lists of species caught by the Lady Hammond and Cape Chidley at comparable sampling depths. There were differences in the relative importance of these species between trawl and video surveys which could reflect differences in gear selection or sampling design, e.g. restriction of video sampling to canyons.
Markle et al. (1988) found the slope fauna off Nova Scotia to have many similarities with the temperate fauna of the Mid-Atlantic Bight, i.e. the area from south of Georges Bank to Cape Hatteras, as characterized by Sulak (1982). Other descriptions of that fauna are given by Markle and Musick (1974) and Haedrich et al. (1975). Markle et al. (1988) did, however, note substantial differences between the Scotian Slope fauna and that off southeastern Grand Bank (Snelgrove and Haedrich, 1985) in terms of dominant species, diversity and depth distributions. Pinhorn and Halliday (1997) subsequently proposed, based on research vessel trawl surveys conducted in 1949–91, that The Tail of Grand Bank (about 51°W) was a boundary of importance to the distribution of slope fish species, 'northern' species occurring at reduced densities (and/or at greater depth) to the west and 'southern' species occurring in lesser abundance to the east. This was attributed to the influence of the cold Labrador Current, which bathes northeastern slopes with water less than 4°C to depths of at least 1 000 m but turns offshore at about this location. However, their data for southern Grand Bank and west was restricted very largely to upper slope depths.
Direct comparisons of faunal composition and species abundances obtained from present data with those from previous surveys at similar depths are confounded by differences in survey design and by the large differences in gear size and vessel fishing power. The differences in vessels and gears used are particularly pertinent to comparisons with those surveys in the Mid Atlantic Bight that used shrimp trawls (Markle and Musick, 1974; Haedrich et al., 1975; Haedrich et al., 1980; Sulak, 1982). These trawls were substantially smaller (headline height of about 2.0 m) than that used in present surveys and they were towed at half the speed (1.5 knots). Testimony to a difference in fishing capability is provided by the Cape Chidley captures of large mobile species, which would have the greatest capability for avoidance of small slow-moving nets. While Chimaeriformes and sharks comprise a third of numbers and almost half the weight caught on Cape Chidley surveys, these taxa were of minor to no importance in Mid-Atlantic Bight survey catches, and this must surely be an effect of sampling.
In areas to the north and east of the present study area (NAFO Subareas 2–3), the existence of substantial populations of C. rupestris (Atkinson, 1995), R. hippoglossoides (Bowering and Brodie, 1995) and M. berglax (Murua et al., 2005) has been well established. Present data show that a substantial population of C. rupestris occurs also on the Scotian Slope and that it is a dominant member of the upper – mid slope fauna in that area. Pinhorn (1976) cites an observation of spawning and post-spawning fish "off Nova Scotia", and sexually maturing fish have been observed in the area by one of the present authors (DET). The size at sexual maturation of this species in more northern areas is 40–50 cm (Atkinson, 1995). Thus, the occurrence in present catches of substantial numbers of C. rupestris in the length range 15–40 cm supports a view that the species resides within the surveyed area throughout its life cycle. Reinhardtius hippoglossoides was of moderate abundance in Scotian Shelf slope catches, but nonetheless ranked fourth by weight as all catches were of large fish (>40 cm). This suggests that they were progeny of a more northern spawning population, perhaps that in the Gulf of St. Lawrence (Bowering, 1983). The contribution of M. berglax to present catches was minor. Thus, the data for M. berglax and R. hippoglossoides are consistent with The Tail of Grand Bank being of some biogeographic importance, but there is no clear support for this in the case of C. rupestris. Kulka (2006) identified the Laurentian Channel, immediately adjacent to the Scotian Shelf slope, as the pupping area for C. fabricii, and the high catches in present surveys are consistent with the survey area being the centre of the species distribution.
Acknowledgements
This project was jointly funded by National Sea Products Limited (now High Liner Foods Limited), Lunenburg, Nova Scotia, and by the Canadian Department of Fisheries and Oceans (DFO) through Contribution Agreement No. FP280-4-5353/VB4-07/A94-SF353 of the Atlantic Fisheries Adjustment Programme (DFO scientific authority - R. G. Halliday). At-sea data collection was conducted by HMSC under contract to National Sea Products Limited. The authors are particularly grateful to G. Pohle, HMSC, who managed the field sampling programme, to C. Chambers (then of HMSC), who supervised data collection during the March 1995 survey, and to our collaborators at National Sea Products. We thank D. Kulka, Northwest Atlantic Fisheries Centre, St. John's, Newfoundland and G. Pohle for reviews of an earlier draft.
References
Atkinson, D. B. 1995. The biology and fishery of roundnose grenadier (Coryphaenoides rupestris Gunnerus, 1765) in the Northwest Atlantic. In: Deep-water fisheries of the North Atlantic oceanic slope. A. G. Hopper, (ed.). Kluwer Academic Publishers, p. 51–111.
Baker, K. D., R. L. Haedrich, P. V. R. Snelgrove, V. E. Wareham, E. N. Edingerand K. D. Gilkinson. 2012. Small-scale patterns of deep-sea fish distributions and assemblages of the Grand Banks, Newfoundland continental slope. Deep-Sea Research I, 65: 171–188. http://dx.doi.org/10.1016/j.dsr.2012.03.012
Bowering, W. R. 1983. Age, growth, and sexual maturity of Greenland halibut, Reinhardtius hippoglossoides (Walbaum), in the Canadian Northwest Atlantic. Fish. Bull., 81: 599–611.
Bowering, W. R. and W. B. Brodie. 1995. Greenland halibut (Reinhardtius hippoglossoides). A review of the dynamics of its distribution and fisheries off eastern Canada and Greenland. In: Deep-water fisheries of the North Atlantic oceanic slope. A. G. Hopper, (ed.). Kluwer Academic Publishers, p. 113–160.
Bänón, R. 2001. New record of Cataetyx laticeps (Bythitidae) in Northwestern Atlantic. Cybium, 25: 93–94.
Carrothers, P. J. G. 1988. Scotia-Fundy groundfish survey trawls. Can. Tech. Rep. Fish. Aquat. Sci., 1609: iv+27 p.
Caruso, J. H. 2002. Order Lophiiformes: Chaunacidae. In: The Living Marine Resources of the Western Central Atlantic. K. E. Carpenter, FAO. Rome, 2: 1052–1053.
Clarke, K. R.and R. N. Gorley. 2006. PRIMER v6: User Manual/Tutorial. PRIMER-E, Plymouth, UK. 190 p.
Cohen, D. M., T. Inada, T. Iwamotoand N. Scialabba. 1990. Gadiform fishes of the world (Order Gadiformes). An annotated and illustrated catalogue of cods, hakes, grenadiers and other gadiform fishes known to date. FAO species catalogue Vol. 10, FAO Fisheries Synopsis No. 125.
Eschmeyer, W. N. and R. Fricke. 2012. Catalog of Fishes electronic version (12 Jan 2012). http://research.calacademy.org/research/ichthyology/catalog/fishcatmain.asp.
Geistdoerfer, P. 1986. Macrouridae. In: Fishes of the North-eastern Atlantic and the Mediterranean. P. J. P. Whitehead, M.-L. Bauchot, J.-C. Hureau, J. Nielsen and E. Tortonese (eds.). FAO, Paris, 2: 644–676.
Geistdoerfer, P. 1990. Macrouridae. In: Check-list of the fishes of the tropical Atlantic, Clofeta. J. C. Quéro, J. C. Hureau, C. Karrer, A. Post, and L. Saldanha. UNESCO, Junta Nacional de Investigaçäo Cientifica e Tecnológica, Lisbon, 2: 541–563.
Goode, G. B.and T. H. Bean. 1896. Oceanic Ichthyology. Deep-sea and pelagic fishes of the world. Spec. Bull. U.S. Nat. Mus., 2: 553 p.
Haedrich, R. L.and N. R. Merrett. 1988. Summary atlas of deep-living demersal fishes in the North Atlantic Basin. J. Nat. Hist., 22: 1325–1362. http://dx.doi.org/10.1080/00222938800770811
Haedrich, R. L., G. T. Roweand P. T. Polloni. 1975. Zonation and faunal composition of epibenthic populations on the continental slope south of New England. J. Mar. Res., 33: 191–212.
Haedrich, R. L., G. T. Roweand P. T. Polloni. 1980. The megabenthic fauna in the deep sea south of New England, USA. Mar. Biol., 57: 165–179. http://dx.doi.org/10.1007/BF00390735
Hartel, K. E., C. P. Kenaley, J. K. Galbraithand T. T. Sutton. 2008. Additional records of deep-sea fishes from off Greater New England. Northeastern Naturalist, 15: 317–334. http://dx.doi.org/10.1656/1092-6194-15.3.317
ICES. 2008. Report of the Planning Group on the North-east Atlantic Continental Slope Survey (PGNEACS). ICES CM 2008/LRC:02, 38 p.
Iamoto, T. 2002. Macrouridae. In: The living marine resources of the Western Central Atlantic. K. E. Carpenter, FAO, Rome. Vol. 2: 977–987.
Kulka, D. W. 2006. Abundance and distribution of demersal sharks on the Grand Banks with particular reference to the NAFO Regulatory Area. NAFO SCR Doc. 06/20 (Ser. No. N5237), 36 p.
Markle, D. F., M. J. Dadswelland R. G. Halliday. 1988. Demersal fish and decapod crustacean fauna of the upper continental slope off Nova Scotia from LaHave to St. Pierre Banks. Can. J. Zool., 66: 1952–1960. http://dx.doi.org/10.1139/z88-286
Markle, D. F.and J. A. Musick. 1974. Benthic-slope fishes found at 900 m depth along a transect in the western N. Atlantic Ocean. Mar. Biol., 26: 225–233.
McEachran, J. D.and J. D. Fechhelm. 1998. Fishes of the Gulf of Mexico. University of Texas Press, Austin, 1112 p.
Moore, J., K. E. Hartel, J. E. Craddockand J. K. Galbraith. 2003. An annotated list of deepwater fishes from off the New England region, with new area records. Northeastern Naturalist, 10: 159–248.
Murua, H., F. Gonzálezand D. Power. 2005. A review of the fishery and the investigations of roughhead grenadier (Macrourus berglax) in Flemish Cap and Flemish Pass. J. Northw. Atl. Fish. Sci., 37: 13–27. http://dx.doi.org/10.2960/J.v37.m567
Møller, P. R., J. G. Nielsen, S. W. Knudsen, J. Y. Poulsen, K. Sünksenand O. A. Jørgensen. 2010. A checklist of the fish fauna of Greenland waters. Zootaxa, No. 2378: 1–845.
Pinhorn, A. T.and R. G. Halliday. 1997. The Tail of the Grand Bank, southeast of Newfoundland, as a geographical boundary for continental slope fishes. Can. J. Zool., 75: 1753–1772. http://dx.doi.org/10.1139/z97-805
Pinhorn, A. T. ed. 1976. Living marine resources of Newfoundland - Labrador: status and potential. Bull. Fish. Res. Bd. Can., 194: 64 p.
Roule, L.and F. Angel. 1933. Poissons provenant des campagnes du Prince Albert I de Monaco. Résult. Camp. Scient. Prince Albert I, 86: 1–115, 4 pl.
Scott, W. B.and M. G. Scott. 1988. Atlantic Fishes of Canada. Can. Bull. Fish. Aquat. Sci., 219: 731 p.
Snelgrove, P. V. R.and R. L. Haedrich. 1985. Structure of the deep demersal fish fauna off Newfoundland. Mar Ecol. Prog. Ser., 27: 99–107. http://dx.doi.org/10.3354/meps027099
Sulak, K. J. 1982. A comparative taxonomic and ecological analysis of temperate and tropical demersal deep-sea fish faunas in the western North Atlantic. Ph.D. dissertation, Rosenstiel School of Marine and Atmospheric Science, University of Miami, Miami, Florida, USA, 211 p.
Sulak, K. J. 1990. Halosauridae. In: Checklist of the fishes of the tropical Atlantic, Clofeta. J. C. Quéro, J. C. Hureau, C. Karrer, A. Post and L. Saldanha. UNESCO, Junta Nacional de Investigaçäo Cientifica e Tecnológica, Lisbon, 1: 126–132.
Sulak, K. J., P. D. MacWhirter, K. E. Luke, A. D. Norem, J. M. Miller, J. A. Cooperand L. E. Harris. 2009. Identification guide to skates (Family Rajidae) of the Canadian Atlantic and adjacent regions. Can. Tech. Rep. Fish. Aquat. Sci., 2850: viii+34 p.
Templeman, W. 1966. A record of Bathypterois dubius Vaillant from the western North Atlantic, and review of status of the species. J. Fish. Res. Bd. Canada, 23: 715–722. http://dx.doi.org/10.1139/f66-061
Themelis, D. E.and R. G. Halliday. 2012. Species composition and relative abundance of the mesopelagic fish fauna in the Slope Sea off Nova Scotia, Canada. Northeastern Naturalist, 19: 177–200. http://dx.doi.org/10.1656/045.019.0204
|