Introduction
Sampling is an essential process for studying a fish population. Scientific sampling designs help scientists to have a representative view of target population with limited efforts. In fisheries, because of different characteristics of target species (e.g., spatial structure) and objectives of sampling (e.g., estimators), different sampling designs are required to gain maximal efficiency (Liu et al., 2009; Simmonds and Fryer, 1996; Wang et al., 2009). Of the sampling designs, simple random sample without replacement (SRS) is more commonly used as a null design for comparing the efficiency (relative variance) of different sampling schemes than as an optimal practical fishery survey design (Pooler and Smith, 2005; Skibo et al., 2008).
Stratified random sampling approaches are commonly adopted in periodic fishery-independent surveys for tracking the temporal trend of abundance and estimating the total abundance at the defined spatial scale (Gavaris and Smith, 1987). Stratified designs can spread the sampling effort over the study area to improve the precision of estimates especially when there are heterogeneities between strata and homogeneities within a stratum (Lohr, 2009). Systematic sampling (SYS) tends to be more precise when there are spatial correlations between observations (Cochran 2007, Rivoirard et al., 2000). Stratified random designs allow for estimating the precision of the estimates of total abundance whereas the SYS does not. Other sampling schemes can also be designed for specific cases. For example, adaptive cluster sampling strategies were designed for use in cases of rare or highly aggregated populations (Skibo et al., 2008; Thompson 1990).
An ideal sampling scheme is always constrained by budget and logistics (Lohr, 2009). Therefore, it is important and necessary to optimize the sampling design and maximize the information output from limited sampling efforts. Computer simulations are commonly used for evaluating and comparing different sampling designs in identifying optimal sampling design (Liu et al., 2009; Simmonds and Fryer, 1996). The sampling process of proposed designs is simulated on hypothetical “true” populations. Performance indices of different sampling strategies can be calculated based on defined criteria associated with sampling objectives. In general performance indices include measures of accuracy, which reflects the closeness to the true value; precision, which shows the extent to which repeated measurements or calculations gain the same or similar results (Taylor, 1997); and design effect, which measures the improvement in sampling efficiency of a particular sampling design over the SRS. The design effect is often calculated as the ratio of the estimator’s variance that would be obtained from SRS to the variance obtained from an alternative sampling design with the same total sample size (Kish, 1965).
Estimating population abundance index or total abundance is usually the primary objective for periodic fishery-independent surveys which are critical to fish stock assessment and management (Smith and Lundy, 2006). The precision of these estimates is important in influencing uncertainty associated with stock assessment and subsequent development of decision rules of fisheries management (Smith and Lundy, 2006). Improving the precision of survey estimates can lead to reduced uncertainty in assessment model estimates of stock size and improve fisheries management.
For a stratified random designed survey, many studies revealed that optimizing either sample allocation schemes or stratification schemes could lead to an increased precision of survey means or total estimates (Folmer and Pennington, 2000; Gavaris and Smith, 1987; Smith and Tremblay, 2003). There are many methods for allocating samples among strata, the most common being to allocate samples in proportion to strata area/size. The Neyman allocation rule allocates samples in proportion to strata variance (Lohr, 2009) although it is difficult to know the variance before a survey is conducted. Typically the variance estimates from previous years’ surveys are used as estimates (Cochran, 2007). Recently, adaptive allocation methods have been developed to increase the precision of estimates from stratified surveys (Smith and Lundy, 2006).
The American lobster, Homarus americanus, are distributed in the northwest Atlantic from Newfoundland, Canada to offshore North Carolina, USA (Lawton and Lavalli, 1995) and support one of the most valuable commercial fishery in the United States, with an ex-vessel value over 500 million dollars in 2013. Multiple fishery-independent surveys with differed spatial coverage were conducted to monitor this important economic species along the northeast American coast. The Maine-New Hampshire inshore trawl survey evaluated in this study yields an abundance index of inshore component of lobster population in the Gulf of Maine (GOM) (Chen et al., 2006), which contributes the majority of commercial catch in the US. This abundance index has been used to calibrate the stock assessment model for the lobster population in the GOM (ASMFC, 2009), thus providing critical information for the management. However, this survey is designed for groundfish monitoring and its performance for capturing the dynamics of lobster population is unknown and needs to be evaluated.
The objectives of this study are: (1) to evaluate the performance of current design (i.e., stratified random sampling) in terms of its accuracy, precision and efficiency by comparing with other possible sampling strategies; (2) to compare alternative allocations of sampling efforts for current stratified sampling design used in the survey; (3) to evaluate the robustness of evaluated sampling schemes over time in order to understand the impacts of lobster spatial dynamics resulting from possible environment changes on sampling strategies. A study such as this one is important to understand the overall performance of the current survey design for monitoring lobster and it could also provide knowledge for designing a fishery-independent survey.
Materials and methods
Maine-New Hampshire Inshore Trawl Survey
The Maine-New Hampshire inshore trawl survey evaluated in this study is a biannual multiple-species fishery-independent survey conducted by the Maine Department of Marine Resources (DMR) each spring and fall since fall of 2000. It follows a stratified random design with four depth strata (9–37 m, 37-64 m, 64-100 m, and >100 m with 12 km offshore limit) and five longitudinal regions based on oceanographic and geological features (Fig. 1). A target of 115 sampling stations was designed for each survey and the number of sample size per stratum was apportioned according to its total area. Groundfish species are the main target species of this survey in its design. However, an estimate of abundance index for American lobster is also a primary sampling objective (Chen et al., 2006). The net is a modified version of shrimp net design used in Maine waters and designed to fish for a variety of near-bottom dwelling species without targeting any specific component.
|
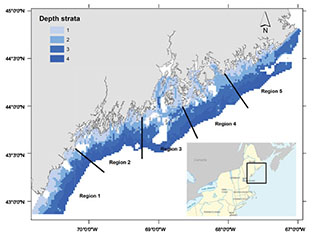
Fig. 1. Region and depth strata for the Maine-New Hampshire inshore trawl survey (white areas are the areas that could not be towed)
|
Simulation of a “true” population
The spatial distribution of American lobster is influenced by many factors such as temperature (Aiken and Waddy, 1986), salinity (Jury et al., 1994), and shelter availability (Wahle and Steneck 1991) and it differs greatly by season, sex, and size class (Chen et al., 2006). Chang et al., (2010) developed a habitat modeling approach for quantifying season-, size-, and sex-specific lobster distribution in the Gulf of Maine. They used a 2-stage general additive model (GAM), with a stage 1 GAM to estimate the probability of presence of lobsters and stage 2 GAM to estimate the lobster density and multiplied the 2 stage model results to estimate the comprehensive lobster density. The model results suggested that lobster distribution was strongly associated with temperature and depth and different seasonally by sex and size classes, which are consistent with the ecology of the American lobster. In this study, the GAM models with bottom temperature, bottom salinity, latitude, longitude, depth, distance offshore, and two substratum features as the explanatory variables were used to estimate the season-, size-, and sex-specific lobster density distribution from 2002 to 2008. The model predictions were summed over size and sex to produce the spatial distribution of total lobster density (per tow) for spring and fall of each year from 2002 to 2008. We considered these time-series spatial distributions as “true” populations in evaluating alternative sampling designs. These “true” populations changed over time with respect to changes in temperature and salinity variables (see details in Chang et al., 2010). The temperature and salinity information for 2002 to 2008 was produced by the Gulf of Maine Ocean Observing System circulation nowcast/forecast system (Xue et al., 2005).
Survey designs
The 3698 potential sampling stations generated by overlaying 1 nautical mile (NM) × 1(NM) grids over the survey area were considered as the sampling frame of this study. Areas that could not be towed were excluded (Fig. 1). Three types of sampling designs were considered:
- SRS: n stations of the potential 3698 sites were randomly selected and sampled;
- Stratified random sampling: four stratification schemes were defined, including four depths, five regions, seven sediments (i.e., gravel, gravel-sand, sand, clay-silt/sand, sand-clay/silt, clay, and sand/silt/clay), and four depths × five regions, and n stations were allocated proportionally to the size of the strata. The stratified mean
 was estimated by taking the weighted mean over all strata (Lohr 2009): was estimated by taking the weighted mean over all strata (Lohr 2009):
 (1) (1)
where nh is the number of stations samples in
- stratum
 is the total number of stations sampled, Nh is the total number of possible stations in stratum h, H is the number of strata is the total number of stations sampled, Nh is the total number of possible stations in stratum h, H is the number of strata  , is the total number of possible stations in the survey area, and , is the total number of possible stations in the survey area, and  is the number of lobster density in station i of stratum h. is the number of lobster density in station i of stratum h.
- SYS: the first station was randomly selected from the total of 3698 grids and the remaining stations n – 1 were evenly spaced in the survey area.
Based on the above three designs, a total of six survey designs were evaluated in this study (Table 1).
For the stratified survey design currently used by Maine DMR, Neyman allocation scheme was used to evaluate if such an approach can improve the precision of estimates. Neyman allocation is the special case of optimal allocation when the costs in the strata are approximately equal (Lohr, 2009). The sample size in the stratum, nh, is proportional to NhSh, where Sh is the variance of stratum h (Lohr, 2009). Sh was assumed to be equal to the population variance of the previous year in stratum h which is estimated based on habitat model. In this case, we allocated more sample to highly variable strata and large strata of the previous year. Also we considered the case that nh is just proportional to Sh which means we just allocate more samples to highly variable strata forecasted by previous year. In most fisheries surveys, mean and variance are related (Smith and Lundy, 2006). Therefore, we also investigated the two allocation schemes with mean substituted for variance. Thus we considered four scenarios of sample allocations for the survey design currently used by the Maine DMR:
- Scenario one: allocating samples based on variances of strata weighted by area
- Scenario two: allocating samples just based on variances of strata
- Scenario three: allocating samples based on means of strata weighted by area
- Scenario four: allocating samples just based on means of strata
Evaluating survey designs
Three indices were used to measure the performance (e.g., accuracy, precision and efficiency) of each sampling scheme. Relative Estimation Error (REE) was used to quantify the accuracy and precision of estimated mean (Chen 1996):
 (2)
We also calculated Relative Bias (RB) for the estimated mean as (Paloheimo and Chen 1996):
 3) 3)where  is the estimated mean in the ith simulated survey, is the estimated mean in the ith simulated survey,  is the true mean, N is the number of simulation times. The REE and RB values reflect both bias and variation in the estimation, and a smaller REE or RB value suggests a better performance (Chen, 1996). The RB value could also indicate whether the sampling design tends to underestimate or overestimate the population mean. is the true mean, N is the number of simulation times. The REE and RB values reflect both bias and variation in the estimation, and a smaller REE or RB value suggests a better performance (Chen, 1996). The RB value could also indicate whether the sampling design tends to underestimate or overestimate the population mean.
The variance of sample mean of each sampling strategy was calculated from the distribution of sample mean generated by repeating the sampling process on the “true” population. Such a variance reflects the variability of sample mean. In theory, the sampling designs considered in this study produce unbiased estimates of population mean. However the unbiasedness does not mean that estimate of mean for a particular simulation run would be equal to the true population mean. Rather, the unbiased estimators have variability; sometimes they would be too low or too high. If the estimates of mean are too variable based on certain design, it would be considered of low precision and less efficient. Design effect,  was used to quantify the difference of sample-to-sample variability between a specified sampling design and SRS: was used to quantify the difference of sample-to-sample variability between a specified sampling design and SRS:
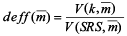 (4)
where is the sample mean, is the variance of sample mean under the kth sampling design, is the variance of sample mean under the SRS design. is the variance of sample mean under the SRS design.
Simulation procedure
The sampling process was simulated for each design by spring and fall from 2002 to 2008 based on the “true populations”. For Design I to Design VI (Table 1), three sample sizes were considered (87, 115, 144) in order to test the impacts of sample size. Simulations could be divided into two steps for each sampling design: (1) draw samples according to a particular design from the “true” population for 1000 times and calculate each performance index; and (2) repeat step 1 for 100 times to capture variability in the simulation and get the distribution of performance indices.
Results
Simulated populations
The predicted spatial pattern of lobster distribution was stable over time for both spring and fall from 2002 to 2008, therefore, only the distributions of 2006 were shown as an example (Fig. 2). In general, lobster density was predicted to be higher in inshore waters. The hot spots were located in the mid-coast region. Those patterns were similar for both spring and fall.
|
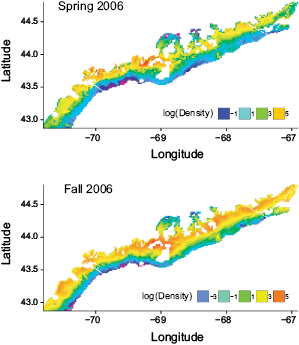
Fig. 2. Simulated ‘true’ population distribution of American lobster in the Gulf of Maine for 2006
|
Survey designs
The values of REE and design effect showed consistently that the performance (i.e., efficiency and precision) of the six survey designs had the following ranking (from best to worst): Design II > Design VI > Design IV > Design V > Design III > Design I. This performance ranking was the same for both spring and fall populations, for different sample sizes (i.e., 87, 115 and 144; Table 2, Fig. 3), and for different years (i.e., from 2002 to 2008; Table 2, Fig. 4). The same pattern in these two indices was apparent for the spring population (not illustrated).
SYS yielded the most precise and efficient estimates of population mean. However, its performance indices (e.g., REE and design effect) showed large variation with the change of sample size (Table 2, Fig. 3). For example, the annual average REE for fall population decreased from 7.11% to 4.92% when sample size increased from 87 to 115. However it increased from 4.92% to 6.49% when sample size increased from 115 to 144. The annual average design effect showed the same pattern. Thus, increased sample size might lead to decreased performances for SYS. Such variation in the design effects and REE also existed in the spring population. In addition, the design effect of SYS differed for spring and fall population with the same sample size, suggesting SYS is likely to be sensitive to different realization of population spatial distribution (Table 2).
|
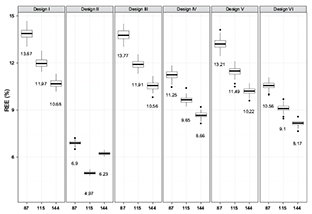
Fig. 3. Comparison of index REE yielded by five evaluated sampling designs with small (87), medium (115) and large (144) sample sizes for fall population of 2002 (values in the plot are medians)
|
The current region-depth stratified design used by DMR performed slightly better in annual average design effect and REE compared to the depth-stratified design alone, when the same sample size was the used. Stratification by regions only contributes a little to the improvement of the efficiency since it just resulted in less than 10% improvement in design effect. Most of the improved efficiency due to the current depth-region-based 20-strata design came from the depth component of the stratification scheme. Sediment-stratified design had the similar efficiency as region-based design. However, its performance differed by season (Table 2). The REE and design effect obtained by region-stratified design and sediment-stratified design were close (Table 2, Fig. 3). The annual average REE values of stratified designs for the estimation of both spring and fall populations decreased as the sample size became larger (Fig. 3). Such a decrease was gained by increasing sample size from 87 to 115 and was larger than the decrease resulting from increasing sample size from 115 to 144. The improvement of precision by increasing the sample size varied with different designs.
The RB values of all the designs except for Design II were distributed evenly around zero (e.g., annual means were less than 0.1%) for any given sample size and population which indicates that the biases of these designs have no tendency to be either negative or positive (Fig. 5). However, for SYS biases tended to be positive consistently across all the years for both spring and fall populations when sample size was 87 and tended to be negative when sample size increased (Fig. 5). The annual average RB values of SYS had relatively large variation with the change of sample size. The SYS might yield overestimated or underestimated population mean compared to the other sampling designs.
|
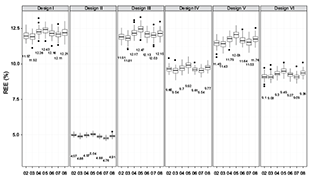
Fig. 4. Performance index (i.e., REE) of five evaluated sampling designs with sample size being 115 across years (i.e., 2002–2008) for fall population (values in the plot are medians)
|
The variations of REE and RB between different years are shown in Figs. 4 and 6. The patterns of REE across the years associated with six sampling designs are almost the same and variations are relative small (Fig. 4). The values of RB across years are stable and show no bias on average for all the sampling designs except SYS (Fig. 6), indicating that different realizations of population distribution in the simulation might not exert a large influence on the performance of those sampling designs.
|
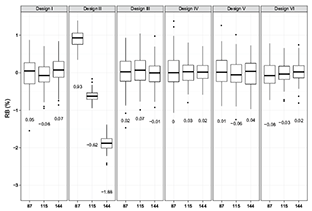
Fig. 5. Comparison of index RB yielded by five evaluated sampling designs with small (87), medium (115) and large (144) sample sizes for fall population of 2002 (values in the plot are medians)
|
In conclusion, SYS gave the most precise and efficient estimates of population mean; however, these estimates were biased. Its precision differed by season and its bias varied across years. Stratified design produced unbiased estimates and its precision and efficiency depends on the stratification strategy. All the stratification strategies evaluated had stable performance across years and seasons except sediment-stratified design whose performance varied with season. However, season-specific performance of sediment-stratified strategy was stable across years.
|
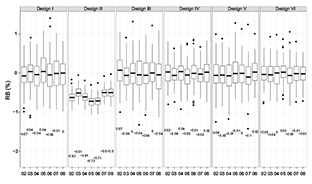
Fig. 6. Performance index (i.e., RB) of five evaluated sampling designs with sample size being 115 across years (i.e., 2002–2008) for fall population (values in the plot are medians)
|
Sample allocations
The results of reallocating samples for Design VI showed that REE of four scenarios reduced by about 2%, suggesting that reallocating samples based on variance or mean of previous year only improved precision slightly. The design effects of the four scenarios decreased by 20% for the years from 2003 to 2008 of both fall and spring populations, suggesting that reallocating samples improved efficiency by about 20%. The RB values were so small (less than 0.1%) that they could be ignored. The performances of the four scenarios are shown in Table 3. Scenario one and two performed best for both spring and fall population through all the years and the performance indices of those two scenarios are very close.
For the fall population, Scenario two performed best for the years of 2003, 2005 and 2008 in which both the REE and design effect were smallest (Table 3). For the year of 2006 the performance of Scenarios three was the best. For the year of 2004 and 2007 Scenario one had the highest precision and efficiency. For the spring population, best scenarios were not consistently suggested by the values of REE and design effect. However the values of those two indices were very close (Table 3). Scenario four did not perform well in any given scenario for both spring and fall populations. Scenario three only performed best in the year of 2006 for the fall population. Variance or weighted variance of immediately previous year was a better indicator for allocating samples to each stratum than the mean.
Discussion
The performance of several sampling designs and different sample sizes in their ability of estimating abundance indices in fishery-independent surveys especially for benthic invertebrate species was examined in several studies (Cabral and Murta, 2004; Smith and Lundy, 2006; Smith and Tremblay, 2003). Although these studies generated insights about performance of various survey designs and sample size, either the number of designs involved or the number of “true” spatial distributions was limited. In this study, the bias relative to the “true” population value and precision and efficiency relative to the variance obtained by SRS, stratified random sampling and SYS were compared, and alternative sampling effort allocation schemes were explored and evaluated using computer simulation based on 14 “true” populations (e.g., spring and fall population each year from 2002 to 2008).
The currently used stratified random sampling design was on average less precise and efficient for estimating population mean than SYS for both spring and fall surveys in all the years investigated. This is consistent with previous studies which suggest that SYS tends to be more accurate than stratified random design (Cochran, 2007; Ripley, 2004). The desirable properties of SYS generally embodies in providing better support for kriging methods which aim to obtain estimates of spatial distribution (Liu et al., 2009). In this study, SYS was demonstrated to out-perform random and stratified random designs for estimating the population mean in terms of precision and efficiency. However, given that RB is non zero for SYS on average, this suggests that the sampling design either over- or under-estimates ‘true’ population mean. Another striking feature of SYS in this study is that precision and design effect are not always improved with increased sample sizes. For example, increasing the sample size by 25% from 115 to 144 would not reduce sampling errors, rather would actually increase the REE and design effect by 32% and 100%, respectively. REE and variance of sample mean did decrease when the sample size approached the entire population globally (Fig. 7). However, local behaviors of REE and variance were complex. There are some major peaks and a lot of small fluctuations in the curves of REE and variance versus sample size (Fig. 7). Therefore, it is difficult to select a specific sample size to reach a specified performance for a SYS design.
|
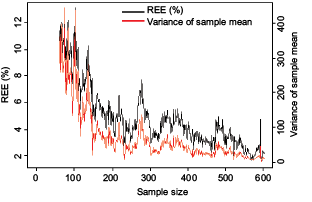
Fig. 7. Change of REE and variance of sample mean yielded by Systematic design with sample size
|
Stratified random design can spread out the samples and often improve the precision and efficiency of survey means compared to SRS (Lohr, 2009). However, this study demonstrates that stratification, if determined inappropriately, such as only using regions to determine strata, makes little contribution to the improvement of precision and efficiency. It is critical to select suitable variables to determine strata. Variables that may greatly influence spatial distribution and population structure of target species are considered to be good choices because the strata determined by such variables tend to make homogeneity within a stratum and heterogeneity between stratum. For example, the stratification based on depth in this study improved the efficiency and precision greatly over SRS. Previous studies revealed that lobster distribution and size composition vary with water depth (Chen et al., 2006; Wahle and Steneck, 1991). However, the stratification based on sediment, which is another variable used in the GAM model for generating the ‘true’ population, did not improve the performance over SRS as much as depth-stratified design did. Although studies have revealed that high lobster density occurs in substrates with boulders (Cooper and Uzmann, 1980) and rocks (Steneck, 2006). Due to the limitation of gear type used in this trawl survey such substrates had limited coverage the trawl survey. Also, variable sediment is not as significant as variable depth in the GAM developed by Chang et al., (2010). This study suggests that no all variables that may influence spatial distribution of lobster are suitable for survey stratficiation.
Reallocating samples among strata can significantly improve the ability of estimating population mean. A reduction of 20% samples from the current sample size (115) could obtain similar precision and efficiency for estimating population mean by reallocating the sampling efforts based on the variances estimated in the previous year. The four scenarios considered in this study yield improvement in efficiency and precision, indicating that variance and mean might be correlated. However, variance tends to be better than mean as an indicator of allocating samples among the strata. The difference between scenario one and scenario two is that variance used in scenario one is weighted by area. The impact of area weight to variance was related to how well the variance of previous year predicting the next’s. For the years that scenario one outweighs scenario two, the reason is that the weighted variances of previous year are more approaching the true variances than those un-weighted.
The current stratified sampling design was found to be robust to different realizations of lobster population, and its performance was stable between seasons and among years. This suggests that the change in temporal and spatial distributions driven by environmental factors such as bottom temperature and salinity has no effect on the ability of appropriate stratified sampling design to estimate the mean. Smith (1996) simulated two very different populations (with and without spatial structure) to show that the underlying distribution and spatial structure of population have no effect on the performance of stratified sampling design in estimating mean and its standard error. Our study is consistent with his study. Such a result indicates that the relative abundance trend of lobster could be well tracked based on the current design without any standardization.
For a fishery independent survey targeting multiple species as the one evaluated in this study stratified random design is more appropriate. Because different species tend to have different spatial distributions, SYS may perform well on one or some, but not all. Additionally, it’s hard to decide a particular sample size for SYS since its performance could dramatically fluctuate with small change of sample size. However appropriate stratified random design is robust to different distributions. Given the variability in fish population distribution over time and space and nature of targeting multispecies in a fishery-independent survey program, stratified random survey design is more desirable for a fishery-independent survey. Defining the sampling frame is a critical issue in a fishery-independent survey. For example, the size of sampling unit can influence the performance of certain sampling designs (Pennington and Volstad 1991). In this study the sampling unit was defined as 1NM × 1NM and some potential sampling units were excluded due to the operability of gear type. Studies may be needed to evaluate the impacts of sampling frame on the inshore bottom trawl survey for the American lobster.
This study suggests that stratified random survey design used in the Maine bottom trawl survey can yield abundance index estimates that can reliably capture spatial and temporal variability of American lobster population along the coast of Maine covered by the survey program. The use of the abundance index in the lobster stock assessment (ASMFC, 2009) is thus desirable. Similar approach used in this study can also be used for other fish species to evaluate the reliability of abundance index derived from a fishery-independent survey program in capturing fish stock dynamics in stock assessment.
Acknowledgements
Financial support of this study was provided by the Maine Sea Grant College program via a research grant to Y. Chen (NA10OAR4170081). Survey data were made available to this study by Maine Department of Marine Resources. In particular we would like to thank Sally Sherman, Keri Stepanek, and Carl Wilson for helping compile the data and provide relevant information. Some of the data analyses were supported by the Shanghai Ocean University International Center for Marine Studies.
References
ASMFC (Atlantic States Marine Fisheries Commission). 2009. American lobster stock assessment report for peer review. ASMFC, Arlington, VA.
AIKEN, D. E., and S. L. WADDY. 1986. Environmental influence on recruitment of the American lobster Homarus americanus: a perspective. Canadian Journal of Fisheries and Aquatic Sciences, 43: 2258–2270. http://dx.doi.org/10.1139/f86-277
CABRA L, H. N., and A. G. MURTA. 2004. Effect of sampling design on abundance estimates of benthic invertebrates in environmental monitoring studies. Marine Ecology Progress Series, 276: 19–24. http://dx.doi.org/10.3354/meps276019
CHANG, J. H., Y. CHEN, D. HOLLAND, and J. GRABOWSKI. 2010. Estimating spatial distribution of American lobster Homarus americanus using habitat variables. Marine Ecology Progress Series, 420: 145–156. http://dx.doi.org/10.3354/meps08849
CHEN, Y. 1996. A Monte Carlo study on impacts of the size of subsample catch on estimation of fish stock parameters. Fisheries Research, 26: 207–223. http://dx.doi.org/10.1016/0165-7836(95)00447-5
CHEN, Y., S. SHERMAN, C. WILSON, J. SOWLES, and M. KANAIWA. 2006. A comparison of two fishery-independent survey programs used to define the population structure of American lobster
(Homarus americanus) in the Gulf of Maine. Fisheries Bulletin, 104: 247–255.
COCHRAN, W. G. 2007. Sampling Techniques. 3rd Edn. Wiley India Pvt. Ltd.
COOPER, R. A., and UZMANN, J. R. 1980. Ecology of juvenile and adult Homarua. In: The Biology and Management of Lobsters. J. S. Cobb, and B. F. Phillips. (eds.) Acadamic Press: New York, p. 97–142. http://dx.doi.org/10.1016/B978-0-08-091734-4.50010-X
FOLMER, O., and M. A. PENNINGTON. 2000. Statistical evaluation of the design and precision of the shrimp trawl survey off West Greenland. Fisheries Research, 49: 165–178. http://dx.doi.org/10.1016/S0165-7836(00)00196-X
GAVARIS, S., and S. J. SMITH. 1987. Effect of allocation and stratification strategies on precision of survey abundance estimates for Atlantic Cod (Gadus morhua) on the Eastern Scotian Shelf. Journal of Northwest Atlantic Fishery Science, 7: 137–144. http://dx.doi.org/10.2960/J.v7.a16
JURY, S. H., M. T. KINNISON, W. H. HOWELL, and W. H. WATSON, 1994. The behavior of lobsters in response to reduced salinity. Journal of Experimental Marine Biology and Ecology, 180: 23–37.
KISH, L. 1965. Survey sampling. John Wiley & Sons: New York.
Lawton, P., and K. L. Lavalli. 1995. Postlarval, juvenile, adolescent and adult ecology. In: Biology of the lobster: Homarus americanus. J. R. Factor (ed.) Academic Press, San Diego, CA, p. 47–88. http://dx.doi.org/10.1016/B978-012247570-2/50026-8
LIU, Y., CHEN, Y., and J. CHENG. 2009. A comparative study of optimization methods and conventional methods for sampling design in fishery-independent surveys. ICES Journal of Marine Science, 66: 1873–1882. http://dx.doi.org/10.1093/icesjms/fsp157
LOHR, S. L. 2009. Sampling: design and analysis. 2nd Edn. Brooks/Cole, California.
PALOH EIMO, J. E., and Y. CHEN. 1996. Estimating fish mortalities and cohort sizes. Canadian Journal of Fisheries and Aquatic Sciences, 53: 1572–1579. http://dx.doi.org/10.1139/f96-077
PENNINGTON, M., and J. H. VOLSTAD. 1991. Optimum size of sampling unit for estimating the density of marine populations. Biometrics, 47: 717–723. http://dx.doi.org/10.2307/2532157
POOLER, P. S., and D. R. SMITH. 2005. Optimal sampling design for estimating spatial distribution and abundance of a freshwater mussel population. Journal of the North American Benthological Society, 24: 525–537. http://dx.doi.org/10.1899/04-138.1
http://dx.doi.org/10.1899/0887-3593(2005)024\[0525:OSDFES\]2.0.CO;2
RIPLEY, B. D. 2004. Spatial statistics. Wiley-Interscience.
RIVOIRARD, J., J. SIMMONDS, and K. G. FOOTE. 2000. Geostatistics for estimating fish abundance. Blackwell Science, Oxford. http://dx.doi.org/10.1002/9780470757123
SIMMONDS, E. J., and R. J. FRYER. 1996. Which are better, random or systematic acoustic surveys? A simulation using North Sea herring as an example. ICES Journal of Marine Science, 53: 39–50. http://dx.doi.org/10.1006/jmsc.1996.0004
SKIBO, K. M., C. J. SCHWARZ, and R. M. PETERMAN. 2008. Evaluation of sampling designs for red sea urchins Strongylocentrotus franciscanus in British Columbia. North American Journal of Fisheries Management, 28: 219–230. http://dx.doi.org/10.1577/M06-293.1
SMITH, S. J. 1996. Analysis of data from bottom trawl surveys. NAFO Scientific Council Studies, 28: 25–53.
SMITH, S. J., and M. J. LUNDY. 2006. Improving the precision of design-based scallop drag surveys using adaptive allocation methods. Canadian Journal of Fisheries and Aquatic Sciences, 63: 1639–1646. http://dx.doi.org/10.1139/f06-063
SMITH, S. J., and M. J. TREMBLAY. 2003. Fishery-independent trap surveys of lobsters (Homarus americanus): design considerations. Fisheries Research, 62: 65–75. http://dx.doi.org/10.1016/S0165-7836(02)00251-5
STENECK, R. S. 2006. Possible demographic consequences of intraspecific shelter competition among American lobsters. Journal of Crustacean Biology, 26: 628–638. http://dx.doi.org/10.1651/S-2753.1
TAYLOR, J. R. 1997. An introduction to error analysis: the study of uncertainties in physical measurements. University Science Books.
THOMPSON, S. K. 1990. Adaptive cluster sampling. Journal of the American Statistical Association, 85: 1050–1059. http:// dx.doi.org/10.1080/01621459.1990.10474975
WAHLE, R. A., and R. S. STENECK, 1991. Recruitment habitats and nursery grounds of the American lobster Homarus americanus: a demographic bottleneck? Marine Ecology Progress Series, 69: 231–243. http://dx.doi.org/10.3354/meps069231
WANG, Y. G., Y. YE, and D. A. MILTON, 2009. Efficient designs for sampling and subsampling in fisheries research based on ranked sets. ICES Journal of Marine Science, 66: 928–934. http://dx.doi.org/10.1093/icesjms/fsp112
XUE, H. J., L. SHI, S. COUSINS, and N. R. PETTIGREW. 2005. The GoMOOS nowcast/forecast system. Continental Shelf Research, 25: 2122–2146. http://dx.doi.org/10.1016/j.csr.2005.04.014
|