Introduction
In 2009, Canada’s Department of Fisheries and Oceans (DFO) introduced the Sustainable Fisheries Framework Policy (SFF; DFO, 2009a) to provide a more rigorous and comprehensive approach to managing Canada’s marine fisheries. A key component of this Policy is “A Fishery Decision-Making Framework Incorporating the Precautionary Approach” (DMF; DFO, 2009b) which describes a general fishery decision-making framework for implementing a harvest strategy that complies with the Precautionary Approach (PA) as defined by the United Nations Fish Stocks Agreement (UN, 1995) and by the Food and Agriculture Organization of the United Nations (FAO; FAO, 1995). Central to the Policy’s approach is the identification of desirable (target) and undesirable (limit) reference points, and specification of management objectives that avoid limits and achieve targets with regard to spawning stock biomass (SSB) and fishing mortality (F). The FAO guidelines suggest that this be achieved through decision rules that specify what management action will be taken when specified deviations from operational targets are observed. In practice, following the UN Agreement and FAO guidelines is not mandatory in Canada because the Fisheries Act allows for “ministerial discretion” in all decisions. In most cases, targets have not been defined and probability thresholds and time horizons with respect to management objectives have not been developed for Canadian fish stocks in DFO fishery management plans.
The DMF defines three zones based on stock status (typically measured in units of SSB: Healthy, Cautious and Critical Zones (Fig. 1). The Healthy Zone occurs above an Upper Stock Reference (USR). The Target Reference Point (TRP) for a stock is set within this Zone by fishery managers. Below the Healthy Zone is the Cautious Zone, bounded at low stock status by the Limit Reference Point (LRP). Below the LRP is the Critical Zone, which denotes a stock at a critically low level of SSB. To prevent a stock from entering the Critical Zone, a reduction in F is required when the stock is in the Cautious Zone in order to ensure it rebuilds to the Healthy Zone rather than declining further and entering the Critical Zone. If a stock is already in the Critical Zone, then it must be rebuilt, with high probability (i.e., 75–95%), to the Cautious Zone within 1.5–2 generations. Once in the Cautious Zone, management actions are required to continue to rebuild the stock to the Healthy Zone within an additional 1.5–2 generations. Thus, the total amount of time to rebuild from the Critical Zone to the Healthy Zone could be up to 4 generations in length.
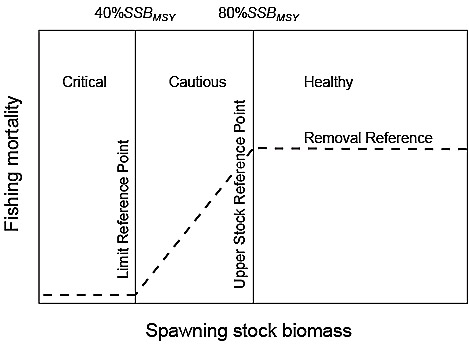
Fig. 1. Elements of the Provisional Harvest Control Rule (PHCR) for the Canada Department of Fisheries and Oceans’ (DFO) Fishery Decision Making Framework Incorporating the Precautionary Approach. The Removal Reference denotes the upper limit of fishing mortality (F) in each of the three spawning stock biomass (SSB) Zones. In the Healthy Zone, F must be less than or equal to the F that generates maximum sustainable yield (FMSY). F must be decreased for a declining stock in the Cautious Zone to ensure a return to the Healthy Zone. In the Critical Zone, F must be kept at an absolute minimum. Under the DFO PHCR, the Upper Stock Reference Point is set at 80%SSBMSY, where SSBMSY is the SSB consistent with fishing at FMSY and the Limit Reference Point is set at 40%SSBMSY. The Target Reference Point for SSB is set at a level within the Healthy Zone by fishery managers.
|
The DMF introduces a Removal Reference (Fig. 1), typically expressed in terms of F, which prescribes the maximum acceptable harvest rate for the stock in each of the three SSB Zones. F in the Healthy Zone must be less than or equal to the harvest rate associated with maximum sustainable yield (FMSY) and in the Cautious Zone, there must be a progressive decline in F with decreasing stock status. A Harvest Control Rule (HCR) determines the change in F. Below the LRP, the harvest rate, taking into account discards and landings, must be kept to an absolute minimum. The specific harvest rate required when the stock is below the LPR is undefined in the DMF but subsequent assessments of some stocks have shown that it can include both bycatch and directed fishing.
While the DMF recognises that stock-specific characteristics, such as life history, should be taken into consideration when developing specific HCRs for individual stocks, it also provides guidance on a Provisional Harvest Control Rule (PHCR) as an example of an HCR considered to be generally consistent with the SFF and DMF policies. In keeping with a number of management strategies applied elsewhere (Restrepo and Powers, 1999; Lassen et al., 2014; Shelton and Morgan, 2014), the PHCR is based on MSY reference points. Elements of the PHCR have been implemented for a number of Atlantic Canada fish stocks including: Units 1, 2 and 3 Redfish (McAllister and Duplisea, MS 2012; Duplisea et al., MS 2012); 3Pn4RS Atlantic Cod (Duplisea and Fréchet, MS 2009); 3NOPs4VWX+5 Atlantic Halibut (Trzcinski et al., MS 2011); 4VsW Atlantic Cod and 4X5Y Haddock (DFO, 2012); 4VW+4Xmn Pollock (Stone, MS 2012; DFO, 2011a); and 3Ps American Plaice (Morgan et al., MS 2012), as well as Pacific stocks such as Queen Charlotte Sound Pacific Ocean Perch (DFO, 2011b).
Simulation testing of fishery management strategies is widely considered to be good practice to ensure robustness to uncertainty (Deroba and Bence, 2008; 2012; Zhang et al., 2011; Wiedenmann et al., 2013; Punt et al., 2014). However, there has only been limited testing of management strategies on Canadian fish stocks (e.g. Cox and Kronlund, 2008; Cleary et al., 2010; Shelton and Miller, MS 2009; Miller and Shelton, 2010) and no tests of the likely effectiveness of the PHCR for specific stocks, or more generally, under a range of life histories, process errors and measurement errors. Instead of simulation testing of management strategies, the DMF requires empirical evaluation of the management strategy 6–10 years after implementation. The first of such empirical evaluations has yet to take place and details regarding the approach are not available in the DMF. It is assumed such an evaluation would depend on a review of survey and catch outcomes and stock assessment reconstructions of the population, and that simulation tests of the PHCR on a stock-by-stock basis would augment this empirical evaluation.
The objective of the present study was to evaluate the general performance of the PHCR for three simulated hypothetical fish populations with different life histories and under a range of assumed process and measurement errors. Performance criteria for evaluating the PHCR were developed from the DMF’s management objectives with regard to SSB, F and catch. This study is considered preliminary because it was not stock-specific and did not implement a full closed-loop management strategy evaluation (MSE) that includes simulating the actual stock assessment process; widely acknowledged as the preferred approach, but one that would have to be stock-specific (Cox and Kronlund, 2008; Punt et al., 2014).
Materials and Methods
In keeping with the MSE approach, the present study considered both the “true” simulated population and the “perceived” population; the population that would be estimated to exist from the stock assessment, taking into account measurement error (Haltuch et al., 2008). The PHCR was applied to the “perceived” population while the performance was measured with respect to the “true” population. Process error was only considered with regard to recruitment and measurement error with regard to SSB. The standard deviation of the errors was assumed to not exceed 0.4, which is moderate compared to some other studies (e.g. Wetzel and Punt, 2016; Cao et al., 2014). Further, it was assumed that reference points required by the PHCR were known exactly.
Provisional harvest control rule
The PHCR defined in the DMF adopted 80%SSBMSYas the USR and 40%SSBMSY as the LRP, where SSBMSY is the spawning stock biomass corresponding to MSY. In accordance with the PHCR, the F applied to the fishery was determined using the following equations:
When the stock is in the “Healthy Zone”,
 (1) (1)
where λ is a constant ≤ 1.
When the stock is in the “Cautious Zone”,
 (2) (2)
When the stock is in the “Critical Zone”,
 (3) (3)
The simulations assumed that l = 1 and that Fy = 0.001 in the Critical Zone acknowledging that, even with no directed fishing, some amount of bycatch will occur. Note that values of Fy > 0 in the Critical Zone create a discontinuity in the HCR at the LRP. Changes to the PHCR to avoid this discontinuity need to be considered if directed fishing is allowed below the LRP.
Simulated populations
Three simulated fish populations representing species with different life history characteristics (Table 1) were constructed in R (R Core Team, 2013). A similar approach was adopted by Wetzel and Punt (2016) in their simulation study of rebuilding strategies for overfished stocks in the U.S.A. and by Wiedenmann et al. (2013) in their evaluation of the performance of harvest control rules on data-poor fisheries. Here, Population A represented a slow-growing, long-lived and late-maturing species that reached a large maximum size, Population C was a fast-growing, short-lived and early-maturing species that grew to a small size, and Population B was an intermediate species in terms of growth, longevity and size. In order to ensure consistency with fish life history theory (Roff, 1992; Beverton, 1992; Sterns, 1992; Charnov, 1993; Jensen, 1996), the following approach was adopted. Maximum (terminal) age (A) was chosen for each population and then natural mortality rate (M) was computed using the empirical equation from Hewitt and Hoenig (2005) where:
 (4) (4)
Based on this value of M, values for the von Bertalanffy growth equation parameter, k, and age at 50% maturity for a logistic maturation function τ50, were computed for each population such that these values satisfied two life history invariant properties proposed by Jensen (1996):
 (5) (5)
and
 (6) (6)
The von Bertalanffy growth equation (Quinn and Deriso, 1999) is:
 (7) (7)
where La is the length at the beginning of age a in centimeters L∞, is the asymptotic length and a0 is the x-intercept of the curve (assumed to be zero for all three simulated populations). Values for L∞ were chosen in descending magnitude for Populations A, B and C, respectively.
Maturation for males and females combined was determined by a population-specific logistic function:
 (8) (8)
where Pa is the proportion mature-at-age and ν is the maturation rate with respect to t50.
Fish weight was obtained from length data by the following equation:
 (9) (9)
where Wa is individual weight in kilograms at age a, La is the length in centimeters at age a and η and ω are constants, considered to be population-invariant in this study based on the relatively small amount of variation that occurs across marine fish species (Froese, 2006).
Spawner-per-recruit in the absence of fishing, SPRF = 0, the expected average lifetime production of spawning biomass from a single age 1 recruit when F = 0, was computed as:
 (10) (10)
where A is the maximum (terminal) age, i.e.. there is no plus group. The omission of a plus group was justified on the basis of the low survival (2–3%) to age A under M for each population.
SPRat F = FMSY (the fully recruited fishing mortality at MSY) was similarly calculated as:
 (11) (11)
where Sa is the fishery selectivity-at-age, arbitrarily set equal to Pa.
Recruitment (R, in thousands of fish) at age 1 at the beginning of year y, N1,y, in the simulated populations was modelled using a Beverton-Holt stock-recruit function (Quinn and Deriso, 1999) with multiplicative, lognormal, autocorrelated process error εpy standardized to have a mean = 1 (Cadigan, MS 2012), such that:
 (12) (12)
where the spawning biomass at the beginning of year y is given by
 (13) (13)
and where


and
 (14) (14)
Here, σ is the standard deviation of the error on a log scale, dy is an annual random normal variable with mean = 0 and standard deviation = 1, and ϕ determined the amount of autocorrelation in the error with ϕ = 0 resulting in no autocorrelation.
To obtain parameters for the Beverton-Holt model, it was re-parameterized in terms of steepness (h) and virgin biomass (K). Steepness is defined as the fraction of R at K when SSB is reduced to 0.2K (Mace and Doonan, 1988). In the re-parameterized formulation,
 (15) (15)
and
 (16) (16)
Steepness cannot be chosen arbitrarily because it depends on life history attributes (Mangel et al., 2010). Values of h for the three simulated populations were therefore chosen to be roughly consistent with the relationship between the ratio  and h described in Mangel et al. (2013) as well as with empirical values of h estimated for real populations with life histories similar to the three simulated populations given in Myers et al. (1999). and h described in Mangel et al. (2013) as well as with empirical values of h estimated for real populations with life histories similar to the three simulated populations given in Myers et al. (1999).
A number of additional life history properties were calculated from those described above to further illustrate the differences between the populations (Table 1). Maximum recruits-per- spawner, RPSmax, was estimated from the slope at the origin of the stock-recruit curve. The intrinsic rate of natural increase at low population size, rmax, was calculated from, RPSmax, SPRF=0, τ50, and M using the method described in Myers et al. (1997). Generation time GT was computed as the weighted mean age where the weights were the age-specific contributions to SPRF=0, based on Goodyear (MS 1994).
The population-updating model applied in the simulations was:
 (17) (17)
where Fa,y was fishing mortality-at-age a in year y, obtained by applying selectivity-at-age, Sa, to the value of Fy generated by the PHCR based on the simulated perceived SSB as described in the following section.
Applying the PHCR to the simulated populations
The PHCR was applied to the perceived SSB at the beginning of year y, SSB*y, to generate the perceived fishing mortality F*y, from which the corresponding total allowable catch (TAC), in tons, was obtained (assuming no implementation error). SSB*y differed from the true simulated SSBy through the introduction of measurement error, so that
 (18) (18)
where εmy is lognormal, autocorrelated, random measurement error obtained using the same equations described above for process error with the subscript changed from to p to m.
F*y was age-disaggregated by multiplying by selectivity-at-age, Sa, assumed to be constant, known and equal to Pa, so that
 (19) (19)
Catch, in thousands of fish at age a in year y, Ca,y, was computed as
 (20) (20)
N*a,y is the perceived numbers at age a at the beginning of year y and was obtained by finding, through iteration, the vector of population numbers-at-age in each year that satisfied
 (21) (21)
subject to the constraint that the proportions-at-age in the perceived population was identical to the proportions in the true simulated population, and considering SSB to comprise the mature biomass of males and females combined.
The TAC given by the PHCR, and therefore the catch, in year y was computed as
 (22) (22)
Because TACy was obtained from the PHCR applied to, SSB*y, Fy corresponding to TACy will differ from F*y generated by the PHCR when measurement error exists.
Fy was found iteratively by satisfying the condition that:
 (23) (23)
Simulation runs
The PHCR was evaluated for each population over a 50-year time horizon. The initial state of the stock was an equilibrium population with a stable age composition consistent with SSB that was 20% of the true SSBMSY, i.e. in the middle of the Critical Zone. For each population, two deterministic reference runs of the simulation model were carried out, the first at F = 0 (i.e. no fishing throughout the 50-year time period) and the second under the application of the PHCR. The PHCR was then applied under stochastic conditions for various values of standard deviation and autocorrelation in process and measurement errors. For each error combination, 1 000 repeats of the simulation were completed to allow performance of the PHCR to be evaluated.
The following runs of the simulation model, totalling 24 each for Populations A, B, and C, were carried out:
- Two deterministic reference runs, under F = 0 and under application of the PHCR;
- Process error-only runs for σp= 0.2 with ϕp = 0, 0.3, 0.6 and 0.9; σp = 0.3 with ϕp = 0 and 0.9; and σp = 0.4 with ϕp = 0 and 0.9;
- Measurement error-only runs with σm = 0.2 with ϕm = 0, 0.3, 0.6 and 0.9; σm = 0.3 with ϕm = 0 and 0.9; and σm = 0.4 with ϕm = 0 and 0.9;
- Combined process and measurement error runs with σ = 0.4 and ϕ = 0.9 for both errors, σp = 0.4 and ϕp = 0.9 combined with σm = 0.2 and ϕm = 0.9, σ = 0.3 and ϕ = 0.9 for both errors, σp = 0.3 and ϕp = 0 combined with σm = 0.3 and ϕm = 0, and σp = 0.4 and ϕp = 0 combined with σm = 0.4 and ϕm = 0.
Performance statistics
Quantitative performance statistics for evaluating the PHCR were derived from the SFF and DMF documents. The following twelve statistics were defined:
- TRCZ is the mean time to reach the Cautious Zone across runs;
- PBCC is the mean probability of SSB falling in the Critical Zone in any one year, subsequent to reaching the Cautious Zone, across runs;
- TRHZ is the mean time to reach the Healthy Zone across runs;
- PRHZ is the mean probability of reaching the Healthy Zone within the 50-year simulation period across runs;
- PBHC is the mean probability of SSB falling in the Cautious Zone in any one year, subsequent to reaching the Healthy Zone, across runs;
- PBHL is the mean probability of SSBfalling in the Critical Zone in any one year, subsequent to reaching the Healthy Zone, across runs;
- PFCM is the mean probability of F exceeding FMSY for years when the stock is in the Cautious Zone, across runs;
- PFA2 is the mean probability of F exceeding 1.2FMSY in any year of the 50 year simulation period across runs;
- PFA5 is the mean probability of F exceeding 1.5FMSYin any year of the 50-year simulation period across runs;
- CV10 is the mean coefficient of variation in the catch over the last 10 years across runs;
- AC50 is the mean of the ratio of catch to MSY over the 50-year simulation period across runs; and
- AC10 is the mean of the ratio of catch to MSY over the last 10 years across runs.
Analysis of performance statistics
Performance statistics for all runs were tabulated. Process error-only and measurement error-only results were plotted to determine the effects of the standard deviation and autocorrelation in the error on performance statistics. Plots covered the range of standard deviation under zero autocorrelation and the range of autocorrelation under σ = 0.2. Minimum and maximum values for each performance statistic were computed across all simulation runs in which the PHCR was applied, including the deterministic runs, to determine the range of outcomes. Analysis of variance (ANOVA) was carried out on the same data to determine overall significance of the main effects, which included Population (A, B or C) and levels of σp, ϕp, σm, and ϕm. A full factorial design was not conducted because all combinations of σ and ϕ for process and measurement error were not evaluated. Because of a balanced design, the order of the main effects did not matter in determining significance. Main effects were considered significant for p < 0.05.
Results
Performance statistics for the simulation trials in which the PHCR was applied under deterministic conditions and process error-only (Table 2) measurement error-only (Table 3) and combined process and measurement error (Table 4) showed considerable variability in some cases, dependent on life history and error combination. In other cases, performance statistics were found to be insensitive to the range of errors examined.
Deterministic reference runs
The simulated SSB values for each of the three populations, under deterministic conditions with no fishing, illustrated the impact of differences in life history (Fig. 2a, Table 2). Population A grew slowly, reaching the Healthy Zone by year 19. Population B reached the Healthy Zone by year five and Population C reached the Healthy Zone by year three. When fishing took place under the conditions of the PHCR, Population A reached the Healthy Zone by year 34, Population B by year 10, while in Population C there was no change in the time to reach the Healthy Zone (Fig. 2b, Table 2). An inflection in population growth occurred earliest and was only slight in Population A but occurred later and was more evident in Populations B and C (Fig. 2b). The inflections were caused by life history-mediated, lagged impacts on SSBas a result of the change in F from a low value in the Critical Zone to increasing F generated by the PHCR with increasing SSB in the Cautious Zone. The PHCR resulted in SSB eventually stabilizing at SSBMSY in Population B and C, however, for Population A, the 50-year time horizon of the simulation was insufficient for this to occur. In the absence of process and measurement error, the expectation is that the PHCR will lead to recovery to the Healthy Zone for stocks that are in the Critical Zone, irrespective of life history differences. However, depending on life history, the time to rebuild to the Healthy Zone under the PHCR could take up to twice as long as it would take in the absence of fishing.
Process error-only runs
Process error-only runs plotted against σp (Fig. 3) and ϕp (Fig. 4) illustrate the impact of these two aspects of variability. Recall that process error was only applied to recruitment. There was no effect of σpon TRCZ, PBCC, PBHL, PFCM, PFA2 and PFA5 (note that where only one line is visible it is because the plots for all three simulated populations were nearly identical). No impact on F-based performance statistics occurred because process error had no impact on the ability of the PHCR to generate the appropriate Fin the process error-only simulations. There was no effect of σp on PRHZ for Populations B and C. However, for Population A, increasing σpnegatively affected PRHZ, although the decrease was small (from 1 to <0.98). The effect of σp on TRHZ was very small, with a slight decrease with increasing σp for Population A and slight increases for Populations B and C. The impact of σp on PBHC was substantial with increases from 0 at σp = 0 to nearly 0.2 for Populations A and C and greater than 0.1 for Population B at σp= 0.4.
 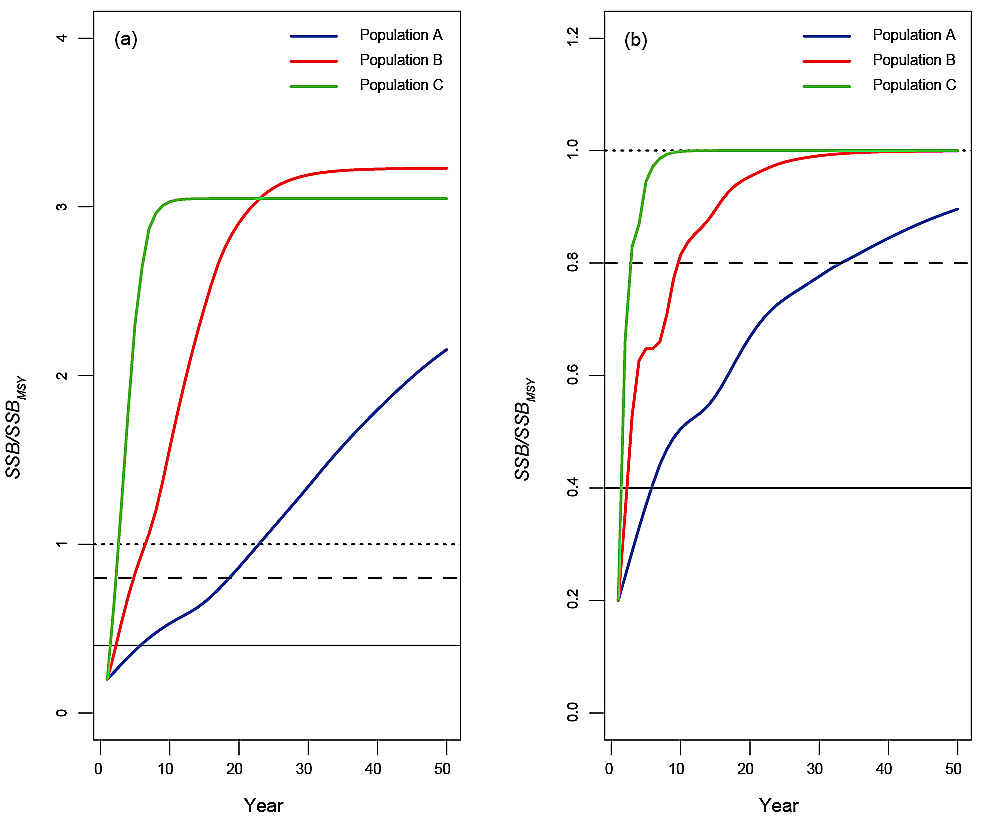
Fig. 2. Results for deterministic reference runs showing SSB (expressed as a proportion of SSBMSY) for Population A (blue), B (red) and C (green) in the absence of fishing (a) and under the Provisional Harvest Control Rule (b), with initial SSB set in the middle of the Critical Zone at 20%SSBMSY. The life histories of the populations are described in Table 1. The horizontal solid black line corresponds to the Limit Reference Point, the horizontal dashed line corresponds to the Upper Stock Reference Point and the horizontal dotted line corresponds to the spawning stock biomass that generates maximum sustainable yield, SSBMSY.
|
Closer examination of the process error runs revealed the reason for less resilience in PBHC with increasing σp in Populations A and C compared with B. Population A took more than 30 years, on average, to reach the Healthy Zone and the median SSB remained close to the boundary between the Healthy and Cautious Zones for the subsequent 20 years. Consequently, variation in Population A caused by process error resulted in more frequent incursions into the Cautious Zone than would have been the case if median SSB were higher and in the Healthy Zone. In the case of Population C, although median SSB rapidly reached a level close to SSBMSY, the sensitivity to process error was greater because there were only a few age classes available to smooth out the variability. The similarity in responses by Populations A and C was therefore coincidental. Population B reached the Healthy Zone in about 10 years, on average, and median SSBreached a level near SSBMSY by year 20. The combination of high median SSBand the buffering effect of multiple age classes for Population B resulted in more resilience in terms of the impact of increasing σp on PBHC compared to the other two populations. Increasing σp resulted in increasing CV10, reaching a level greater than 0.2 for Population A, greater than 0.1 for Population B and greater than 0.5 for Population C, at σp = 0.4. AC50 and AC10 showed slight decreases at high σp for all three populations.
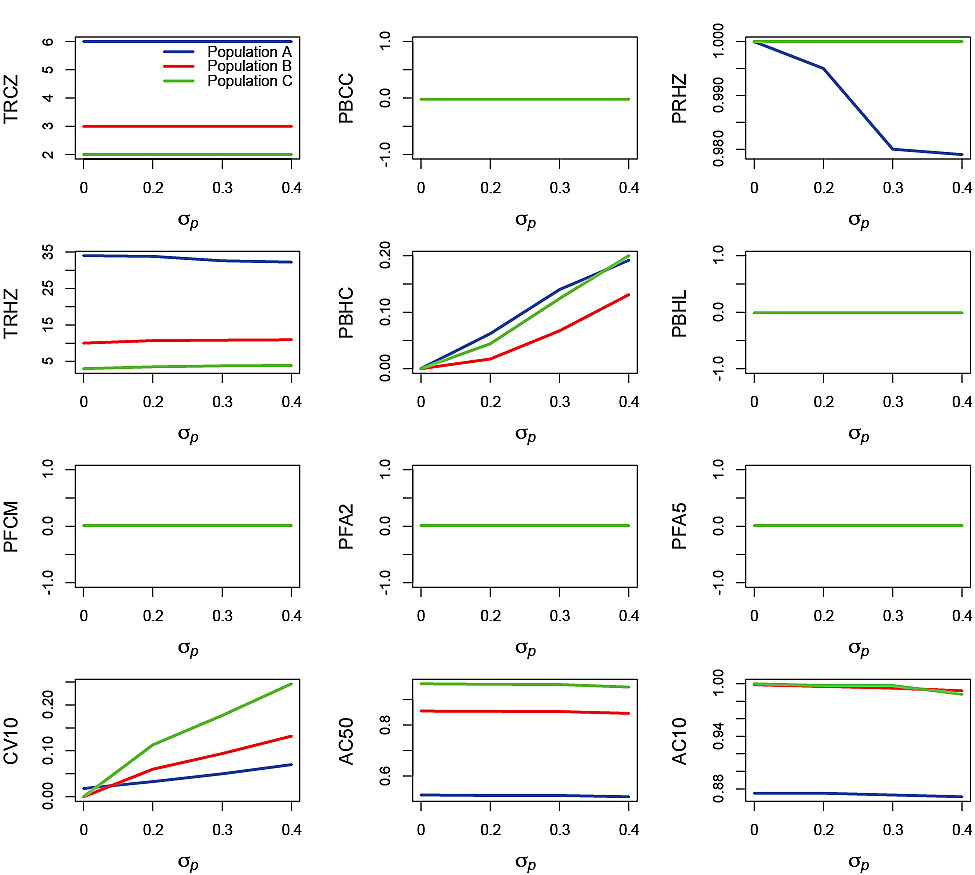
Fig. 3. Effects of the standard deviation of the process error, σp, on performance statistics for simulation runs in which the autocorrelation of the process error ϕp = 0 and the standard deviation of the measurement error σm = 0. Refer to Table 2 for explanations of the performance statistics.
|
There was little or no effect, of increasing ϕp on TRCZ, PBCC, PBHL, PFCM, PFA2, PFA5 and AC50 (Fig. 4). There was little effect of ϕp on PRHZ for Populations B and C, whereas for Population A the probability decreased from 1 at ϕp = 0 to less than 0.85 at ϕp= 0.9. TRHZ decreased slightly with increasing ϕpfor Population A, whereas it increased slightly with increasing ϕpfor Populations B and C. There was generally an increasing trend in PBHC with increasing ϕp for all three populations, however at the highest level of ϕpthere was a decrease in PBHC for Population A. The decrease in PRHZ and PBHC at the highest level of ϕp was caused by interaction between highly autocorrelated process error and the slow SSB response to change due to the life history of Population A. This changed the shape of the uncertainty envelope in which SSBreplicates fell such that fewer replicates reached the Healthy Zone while those that did tended to remain in the Healthy Zone. CV10 increased for all three populations with increasing ϕpup to ϕp= 0.6 and then declined at ϕp= 0.9 (Populations B and C) or levelled off (Population A). Changes in AC10 in response to increasing ϕp were very slight.
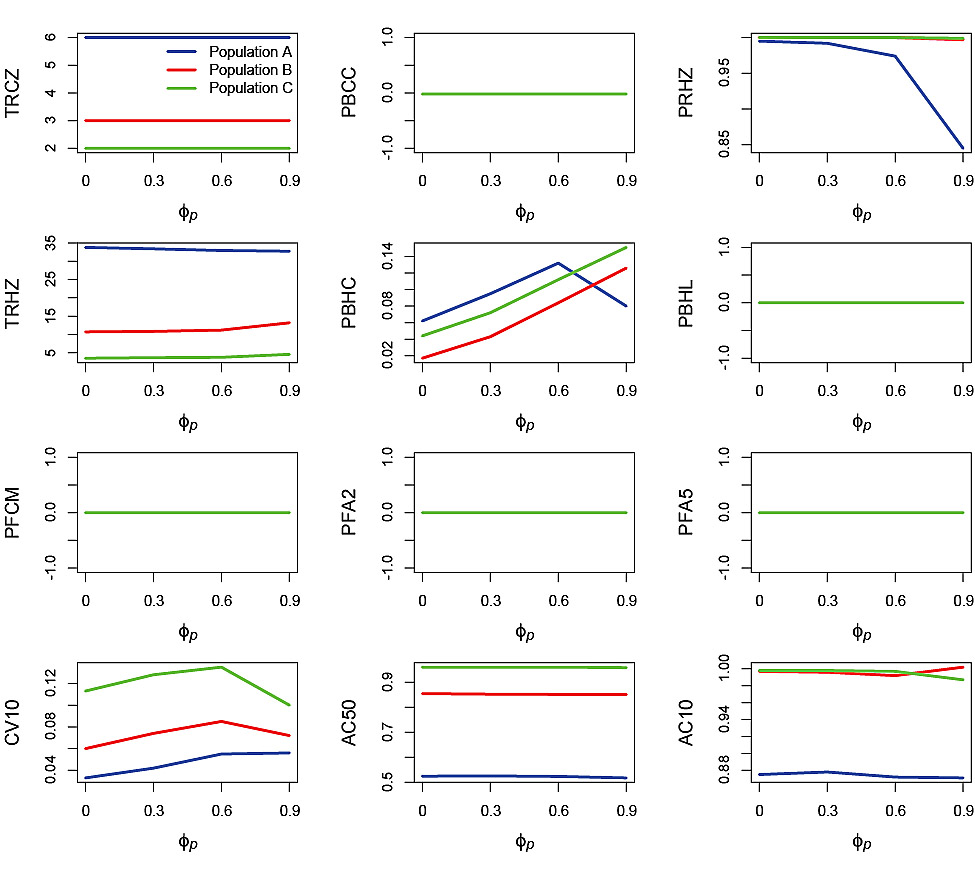
Fig. 4. Effects of autocorrelation in the process error, ϕp, on performance statistics for simulation runs in which the standard deviation of the process error σp = 0.2 and standard deviation of the measurement error σm = 0. Refer to Table 2 for explanations of the performance statistics.
|
Measurement error-only runs
Performance statistics for the simulation trials in which the PHCR was applied under measurement error-only are plotted against σm (Fig. 5) and ϕm (Fig. 6). Recall that measurement error was only applied to SSB. The effect of increasing σm was apparent in all the performance statistics, with the exception of PRHZ and PBHL (Fig. 5). However, the effect was very small on TRCZ and AC50. PBCC increased with increasing σm for all three populations but remained very small overall. TRHZ decreased slightly with increasing σm for Populations A and B. PBHC increased with increasing σm in all three populations, from 0 at σm = 0 to nearly 0.2 in Population C, greater than 0.1 in Population A and about 0.1 in Population B, at σm = 0.4. The three F-based performance statistics increased with increasing σm and were greatest for Population C, intermediate for Population B and least for Population A. The exception was for PFCM, where the effect on Population C declined at σm = 0.3 and σm = 0.4, ending up below the corresponding value for Population B. Probabilities reached as high as 0.3 for PFA2 and 0.2 for PFA5 in the case of Population C while values for the other populations were lower. CV10 increased with increasing σm for all three populations and were around 0.6. AC50 and AC10 decreased slightly with increasing σm, particularly in the case of Population A.
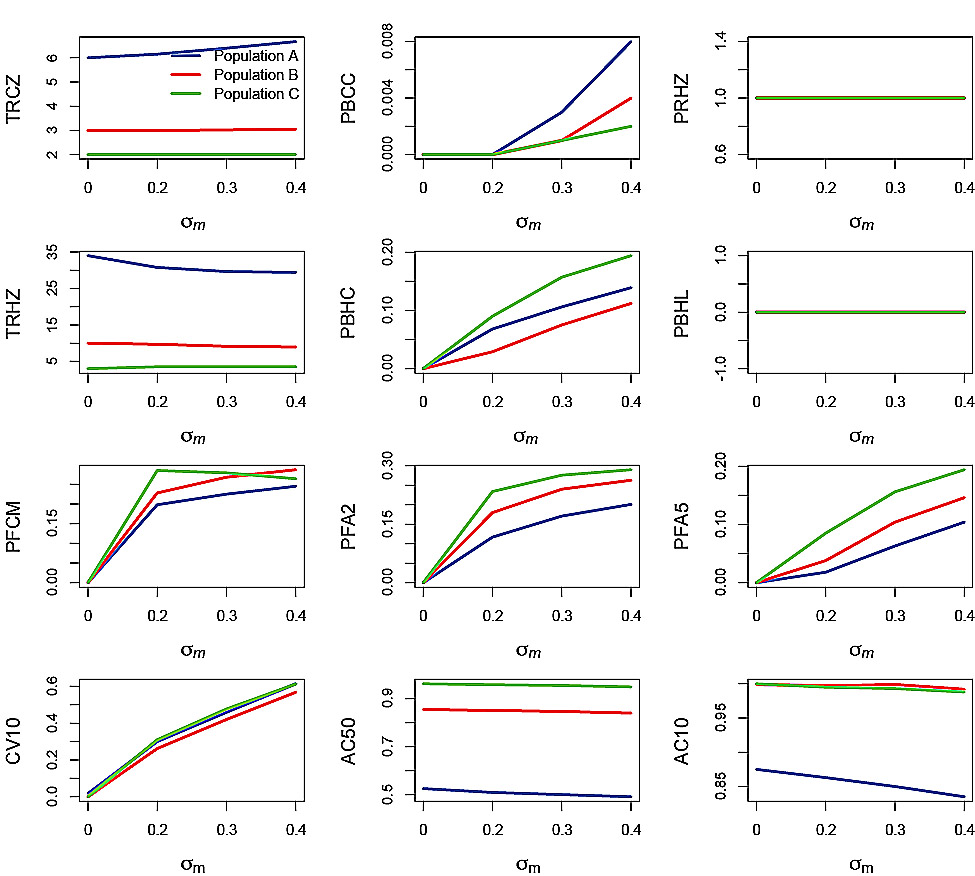
Fig. 5. Effects of the standard deviation of the measurement error, σm, on performance statistics for simulation runs in which the autocorrelation of the measurement error ϕm = 0 and the standard deviation of the process error σp = 0. Refer to Table 2 for explanations of the performance statistics.
|
An effect of ϕm increasing on the performance statistics was most apparent with regard to PBHC, PFCM and CV10 (Fig. 6). PBHC tended to increase with increasing ϕm for all three populations with the exception of Population A at ϕm = 0.9 where there was a decrease. There was a corresponding decrease in PRHZ in Population A at ϕm = 0.9. The reason for these decreases in Population A at the highest level of ϕm was similar to those observed under process error, although in this case the source of variation was due to changes in F which resulted from the PHCR applied to SSB observed with autocorrelated measurement error. PFCM increased with increasing ϕm for Populations B and C but there was no effect on Population A. CV10 decreased with increasing ϕm for all three populations.
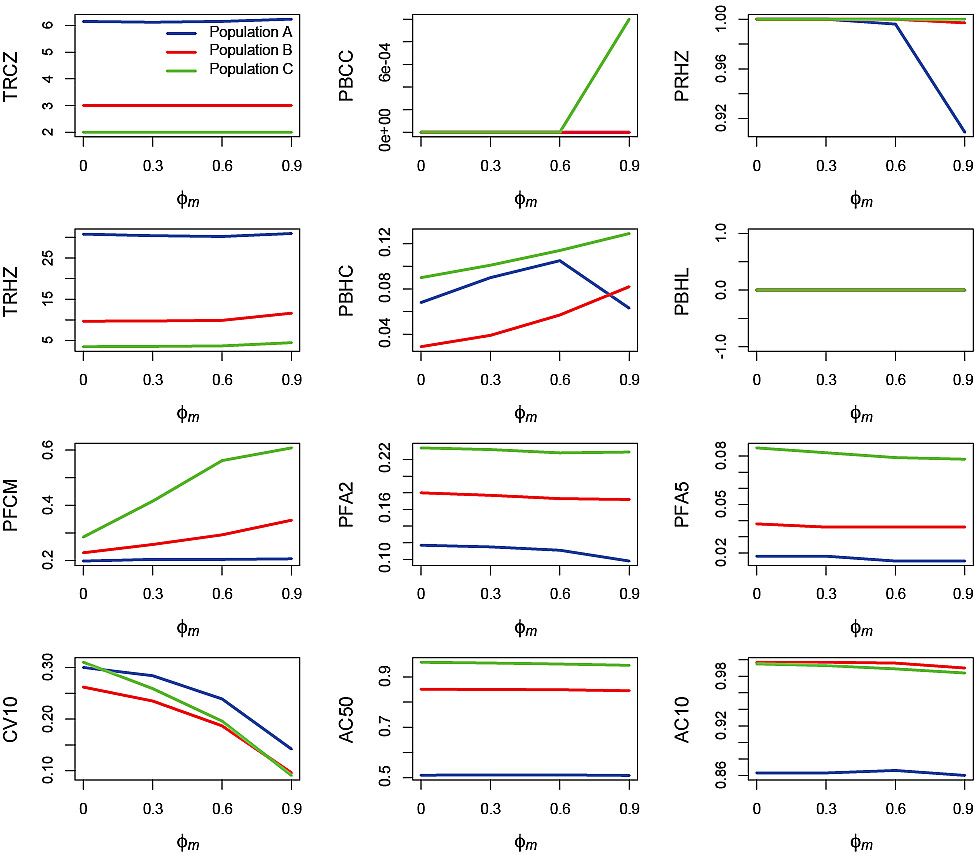
Fig. 6. Effects of the autocorrelation in the measurement error, ϕm, on performance statistics for simulation runs in which the standard deviation of the measurement error σm = 0.2 and standard deviation of the process error σp = 0. Refer to Table 2 for explanations of the performance statistics.
|
Minimum and maximum values
Minimum and maximum values for all performance statistics across all runs in which the PHCR was applied (i.e.. excluding F = 0 runs; data in Tables 2, 3 and 4) showed that TRCZ had a range of 6.00 to 7.18 years for Population A and less than one year for Populations B and C (Table 5). The range in PBCC was less than 0.05 for all three populations. PRHZ had a minimum that was population dependent, being lowest for Population A (0.78) and highest for Population C (close to 1.0). TRHZ had a wide range, more than 6 years for Population A, about 6 years for Population B and about 3.5 years for Population C. Maximum values for PBHC were close to 0.2 for Population A, close to 0.25 for Population B and about 0.3 for Population C. PBHL had a small range and was less than 0.04 for all three populations. The range in PFCM was population-dependent and was widest for Population C with a maximum of about 0.7 and smallest for Population A with a maximum of about 0.25. Maximum values of PFA2 and PFA5 did not vary much across populations with values of about 0.2 to 0.3 for PFA2 and about 0.1 to 0.2 for PFA5. CV10 had a wide range within each population but with a maximum value that was fairly similar across all three populations (0.6–0.68). Maximum values for AC50 were population-dependent with a narrow range within each population. AC10 had an even narrower range within each population.
Analysis of variance
ANOVA results for main effects (Table 6) showed that Population was significant for all performance statistics (Tables 3, 4 and 5) with the exception of PBCC. There was a significant effect of σp on all performance statistics with the exception of TRCZ and PRHZ. ϕp had a significant effect on only five of the performance statistics: PRHZ, PBHC, CV10, AC50 and AC10. The effect of σm on the performance statistics was significant in all cases with the exception of PRHZ. ϕm had a significant effect on five of the performance statistics: PBCC, PFCM, CV10, AC50 and AC10. A comparison across effects showed that the catch-based performance statistics, CV10, AC50 and AC10 were significantly affected by all five main effects. PBHC was significantly affected by four of the five effects, the effect for ϕm being non-significant. PFCM was also significantly affected by four of the five effects, but in this case ϕp was non-significant.
Discussion
In this study, initial trials of the robustness of the PHCR were explored under a range of process errors and measurement errors for three simulated depleted populations with different life histories. Life history had a significant effect on nearly all performance statistics selected for evaluating the PHCR. Both process and observation errors, and to a lesser extent autocorrelation in these errors, had significant effects on many of the performance statistics selected. However, in several cases, the range of values obtained under different error combinations was small (<10%). It should be noted that a danger in the application of ANOVA on simulation results is that any variable with a non-zero effect size can be found to be significant if enough simulations are run. Responses for some of the performance statistics were not consistent across populations. This is attributed to life history differences and the relative impact of autocorrelated errors. For example, the decline in PBHC in the slow-growing, long-lived simulated population, at the highest levels of ϕp and ϕm, was caused by interactions between the lagged response by SSB to variation determined by life history and autocorrelation in the errors, which in the case of ϕm, was mediated through changes in F by the PHCR. The performance of the PHCR would change if time lags in the application of the PHCR were considered. Typically data from y – 1 is used in year y to provide scientific advice for year y + 1, resulting in a two-year lag between data for the terminal year and when the catch advice occurs. These lags were not considered in the present study.
The simulation results showed that the DMF objective of rebuilding stocks from the Critical Zone to the Cautious Zone, with a probability of 75% to 95% within 1.5 to 2 generations (DFO, 2009b), was easily achieved for all three populations irrespective of the errors introduced in the simulations. This result occurred because the TAC in the simulations was set consistent with a very low F of 0.001 when perceived SSB was in the Critical Zone. However, such a low F in the Critical Zone may be unrealistic. For example, Cadigan (2015) estimated fully selected F for status quo catch projections of Northern Cod, a stock well below the LRP, to be 0.124 for his base model, considerably higher than the value of F assumed in the simulations run here. The simulation results suggested that fish stocks in the Critical Zone could rebuild to the Healthy Zone under the PHCR with high probability (> 0.78) irrespective of life history differences and the combinations of process and observations errors. However, the amount of time necessary to rebuild under application of the PHCR was up to twice as long as it took in the absence of fishing. The DMF (DFO, 2009b) suggested that, for a stock in the Cautious Zone, management actions should rebuild the stock to the Healthy Zone in 1.5 to 2 generations. Combining the amount of time defined for rebuilding to the Cautious Zone and then to the Healthy Zone suggested that a time period of up to 4 generations would be acceptable for a stock to rebuild from the Critical Zone to the Healthy Zone, i.e.. between 12 and 74 years for the three simulated stocks considered in the present analysis. Simulation results suggested that the amount of time to rebuild under the PHCR should meet these objectives with high probability despite process and observation errors. However, these rebuilding times may be overly generous. In the United States, federally managed marine fisheries are mandated to rebuild the biomass of overfished stocks to levels that support maximum sustainable yield in as short a time as possible, typically within 10 years, except in cases where the life history characteristics of the stock, environmental conditions or management measures under an international agreement dictate otherwise (Patrick and Cope, 2014). In the simulations, the starting level for all three populations was 20%SSBMSY. Lesser or greater depletion in actual stocks will impact the rebuilding time and, for severely depleted stocks, rebuilding times defined in the DMF may not be met.
Having rebuilt to the Healthy Zone, the simulations found that the PHCR was not effective in ensuring a low probability (<0.1) of preventing the return to the Cautious Zone when recruitment was subject to process error and when the spawning stock size estimates provided to the PHCR were subject to measurement error. The probability of returning to the Cautious Zone increased with increasing standard deviation of both types of errors and, in most cases, with increasing autocorrelation in the errors. The probability was as high as 0.3 in the simulations, depending on the error combination and life history. In some replicates of the simulation at higher levels of process and observation errors and higher autocorrelation in these errors, SSB fell from the Healthy Zone to the Cautious Zone and remained in the Cautious Zone for the remainder of the simulation period. Future studies should consider including an additional performance statistic to capture this response. Reducing F in the Healthy Zone to less than FMSY (i.e. l < 1) could be explored as a way to reduce this probability. Probabilities for returning to the Cautious Zone were highest for Population C and lowest for Population A, suggesting that the PHCR may need to be adapted to account for life history differences, such that a smaller value of λ is adopted for fast-growing, short-lived species. An additional option that could be explored, irrespective of life history, for reducing the probability of returning to the Cautious Zone would be to commence the decrease in F with decreasing SSB at SSBMSY rather than at the USR (80%SSBMSY). On the positive side, there was a very low probability (< 0.05) of a population returning to the Critical Zone under the PHCR once it reached the Cautious Zone.
The PHCR was not effective in keeping F below FMSY in the simulations when the stock was in the Cautious Zone and subject to measurement error, particularly at high levels of autocorrelation. Setting λ < 1 and commencing the reduction in F with decreasing SSBat SSBMSY rather than at the USR, as suggested above, would reduce the probability of high values of Fin the Cautious Zone.
Variation in the annual catch generated by the PHCR in the simulations was high at higher levels of both process error in the population and observation error associated with SSB. This raises concerns that the behaviour of the PHCR may not be consistent with the general desire of the fishing industry to minimize annual catch variation. On the positive side, the PHCR achieved average catches that were close to the msy level once the stock had recovered, except in the case of the slowest-growing and longest-lived population which was still in the process of recovering towards SSBMSY under the PHCR at the end of the 50-year simulation period.
The results from the simulation trials suggested that, depending on the nature of the errors and the life history of the population, the PHCR with l = 1 and the inflection point below which F is reduced (i.e., 80%SSBMSY,) may not result in the desired management outcomes of keeping SSB in the Healthy Zone and avoiding high levels of F, particularly in the Cautious Zone. HCRs can be “tuned” to improve the trade-off in performance statistics so as to better achieve management objectives (Rademeyer et al., 2007). Adjusting λ and the inflection point to improve performance would constitute tuning the HCR. However, tuning the HCR requires that management objectives be clearly stated in terms of targets and limits and that measurable quantitative performance statistics be derived from these objectives. Yet, in most cases, targets have not been defined and probability thresholds and time horizons with respect to management objectives have not yet been developed for Canadian fish stocks in DFO fishery management plans.
The performance statistics applied in these initial trials of the PHCR were informed by the DFO SFF and DMF policies, but remain somewhat arbitrary and may not provide the best representation of management objectives associated with the DFO PA and sustainable fisheries policies. Under the PA, some performance statistics may represent imperative conservation outcomes that have to be achieved at the possible expense of less desirable outcomes with respect to fishery-related performance statistics (Miller and Shelton, 2010). An example of an imperative outcome, consistent with the PA, would be a specific probability threshold that must not being exceeded over some specified time horizon with respect to SSBfalling into the Critical Zone.
The coupling of HCR decision points with biological reference points (USR and LRP) is not a requirement under the DFO SFF and DMF, and an HCR that uses different SSB decision points (e.g. Cox et al., 2013), or doesn’t use SSB decision points at all (e.g. a simple HCR based on relative change in the annual research survey index; Miller and Shelton, 2010), might result in a better trade-off in performance statistics than the PHCR. This could be explored through further simulation studies in which the performance of alternative HCRs is evaluated.
In this study, it was assumed that MSY reference points were known exactly. In practice, they need to be estimated as part of the stock assessment process. This is done either in the initial fitting of the assessment model, or as an additional model fitting exercise applied to estimates of SSB and R obtained from the assessment model. Traditionally, groundfish stock assessments by DFO in Atlantic Canada have been based on Virtual Population Analysis (VPA; Pope, 1972; Quinn and Deriso, 1999) and reference points have been estimated from the fitting of a stock-recruit model to the VPA estimates of SSB and recruitment (e.g. Duplisea and Fréchet, MS 2009). This typically results in the “errors-in-variables” problem (Walters and Ludwig, 1981; Ludwig and Walters, 1981; Hilborn and Walters, 1992; and Quinn and Deriso, 1999), which arises because the estimation method does not account for errors in the independent variable, SSB. The consequence of the “errors in variables problem” is that FMSY is typically over-estimated and SSBMSY is typically under-estimated (Hilborn and Walters, 1992). Process error associated with recruitment can also add bias to the estimates of MSY reference points as a consequence of correlation between the residuals around the stock-recruit curve and subsequent SSB (Walters, 1985). These two sources of bias could negatively impact the performance of the PHCR if they are not taken into account. State-space models that explicitly account for both process and measurement errors in the estimation of the population may be capable of providing estimates of MSYreference points that are less biased (Walters and Martell, 2004), however the development of such models for fish stocks in Atlantic Canada is at an early stage (e.g. Cadigan, 2015).
The current analysis provides an initial evaluation of the DFO PHCR and suggests some potential weaknesses and changes that could be considered to improve performance. This study represents a “best-case” scenario, and therefore, a minimum test of the robustness of the PHCR with respect to achieving management objectives derived from the DMF. Bias in the stock assessment estimates or non-stationarity in biological or fishery parameters will negatively impact the performance of the PHCR. The level of fishing mortality, whether directed or bycatch, applied when a stock is in the Critical Zone is another important area to explore in future research. The PHCR assumes this is negligible, but this may not be realistic (e.g. Cadigan, 2015). The simulation results presented here indicate that rather than simply adopting the PHCR for all stocks, stock-specific HCRs should be developed and tuned to improve performance. However, tuning would require more explicit derivation of quantitative performance statistics to reflect management objectives with respect to both limits and targets, consistent with the DFO SFF and DMF policies.
Acknowledgements
The author would like to thank colleagues at DFO, especially Dr. M. Joanne Morgan for many thoughtful discussions regarding the Precautionary Approach and ways of implementing sustainable fisheries management for the long-term benefit of Canadians. Rob Kronlund of the DFO Pacific Biological Station, Nanaimo BC, provided valuable comments on an earlier version of this manuscript. Three anonymous reviewers and the Associate Editor of JNAFS provided extensive comments, suggestions and editorial help leading to substantial revision.
References
BEVERTON, R. J. H. 1992. Patterns of reproductive strategy parameters in some marine teleost fishes. J. Fish. Biol., 41: 137–160. doi: 10.1111/j.1095-8649.1992.tb03875.x
CADIGAN, N. G. 2012. Impact of stock-recruit and natural mortality process errors on MSY reference points. DFO Can. Sci. Advis. Sec. Res. Doc., 2012/75, 22 p. http://www.dfo-mpo.gc.ca/csas-sccs/Publications/ResDocs-DocRech/2012/2012_075-eng.pdf
CADIGAN, N. G. 2015. A state-space stock assessment model for northern cod, including under-reported catches and variable natural mortality rates. Can. J. Fish. Aquat. Sci., 73: 296–308. doi: 10.1139/cjfas-2015-0047
CAO, J., S. B. TRUESDELL, and Y. CHEN. 2014. Impacts of seasonal stock mixing on the assessment of Atlantic cod in the Gulf of Maine. ICES J. Mar. Sci., 71: 1443–1457. doi: 10.1093/icesjms/fsu066
CHARNOV, E. L. 1993. Life History Invariants. Oxford University Press, Oxford, 167p.
CLEARY, J. S., S. P. COX, and J. F. SCHWEIGERT. 2010. Performance evaluation of harvest control rules for Pacific herring management in British Columbia, Canada. ICES J. Mar. Sci., 67: 2005–2011. doi: 10.1093/icesjms/fsq129
COX, S. P., and A. R. KRONLUND. 2008. Practical stakeholder-driven harvest policies for groundfish fisheries in British Columbia, Canada. Fish. Res., 94: 224–237. doi: 10.1016/j.fishres.2008.05.006
COX, S. P., A. R. KRONLUND, and A. J. BENSON. 2013. The roles of biological reference points and operational control points in management procedures for the sablefish (Anoplopoma fimbria) fishery in British Columbia. Env. Cons., 40: 318–328. doi:10.1017/S0376892913000271
DEROBA, J. J., and J. R. BENCE. 2008. A review of harvest policies: Understanding relative performance of control rules. Fish. Res., 94: 210–223. doi: 10.1016/j.fishres.2008.01.003
DEROBA, J. J., and J. R. BENCE. 2012. Evaluating harvest control rules for lake whitefish in the Great Lakes: Accounting for variable life-history traits. Fish. Res., 121–122: 88–103. doi: 10.1016/j.fishres.2012.01.015
DFO. 2009a. Sustainable Fisheries Framework. http://www.dfo-mpo.gc.ca/fm-gp/peches-fisheries/fish-ren-peche/sff-cpd/overview-cadre-eng.htm
DFO. 2009b. A Fishery Decision-Making Framework Incorporating the Precautionary Approach. http://www.dfo-mpo.gc.ca/fm-gp/peches-fisheries/fish-ren-peche/sff-cpd/precaution-eng.htm
DFO. 2011a. Proceedings of the Western Component Pollock (4Xopqrs5) Management Strategy Evaluation Science Peer Review, 9-10 May 2011. DFO Can. Sci. Advis. Sec. Proceed. Ser., 2011/034. http://www.dfo-mpo.gc.ca/csas-sccs/Publications/Pro-Cr/2011/2011_034-eng.pdf
DFO. 2011b. Stock assessment for Pacific ocean perch (Sebastes alutus) in Queen Charlotte Sound, British Columbia in 2010. DFO Can. Sci. Advis. Sec. Sci. Advis. Rep., 2011/017, 11 p. http://www.dfo-mpo.gc.ca/Csas-sccs/publications/sar-as/2011/2011_017-eng.pdf
DFO. 2012. Reference points consistent with the precautionary approach for a variety of stocks in the Maritimes Region. DFO Can. Sci. Advis. Sec. Sci. Advis. Rep., 2012/035, 35 p. http://www.dfo-mpo.gc.ca/csas-sccs/Publications/SAR-AS/2012/2012_035-eng.pdf
DUPLISEA, D. E., and A. FRÉCHET. 2009. Precautionary reference point estimates for northern Gulf of St. Lawrence (3Pn4RS) cod (Gadus morhua) and methods for their calculation. DFO Can. Sci. Advis. Sec. Res. Doc., 2009/97, 24 p. http://www.dfo-mpo.gc.ca/CSAS/Csas/publications/resdocs-docrech/2009/2009_097_e.pdf
DUPLISEA, D. E., D. POWER, and P. COMEAU. 2012. Reference points for eastern Canadian redfish (Sebastes) stocks. DFO Can. Sci. Advis. Sec. Res. Doc., 2012/105, 22 p. http://www.dfo-mpo.gc.ca/Csas-sccs/publications/resdocs-docrech/2012/2012_105-eng.pdf
FAO. 1995. Technical Consultation on the Precautionary Approach to Capture Fisheries (Including Species Introductions) Lysekil, Sweden, 6– 13 June 1995: Precautionary approach to fisheries. Part 1: Guidelines on the precautionary approach to capture fisheries and Species introductions. FAO Fisheries Technical Paper No. 350/1. http://www.fao.org/docrep/003/W3592E/W3592E00.HTM
FROESE, R. 2006. Cube law, condition factor and weight-length relationships: history, meta-analysis and recommendations. J. Appl. Ichthyol. 22: 241–253. doi: 10.1111/j.1439-0426.2006.00805.x
GOODYEAR, C. P. 1994. An analysis of generation time and the influence of natural mortality on the status and recovery of Gulf of Mexico Red Snapper. Southeast Fisheries Science Center, Miami Laboratory Contribution: MIA-94/95-11, 26 p.
HALTUCH, M. A., A. E. PUNT, and M. W. DORN. 2008. Evaluating alternative estimators of fishery management reference points. Fish. Res., 94: 290–303. doi: 10.1016/j.fishres.2008.01.008
HEWITT, D. A., and J. M. HOENIG. 2005. Comparison of two approaches for estimating natural mortality based on longevity. Fish. Bull. US., 103: 433–437.
HILBORN, R., and C. J. WALTERS. 1992. Quantitative Fisheries Stock Assessment: Choice, Dynamics and Uncertainty. Chapman and Hall, New York, 570 p.
JENSEN, A. L. 1996. Beverton and Holt life history invariants result from optimal trade-off of reproduction and survival. Can. J. Fish. Aquat., Sci., 53: 820–822. doi: 10.1139/f95-233
LASSEN, H., C. KELLY, and M. SISSENWINE. 2014. ICES advisory framework 1977–2012: from Fmax to precautionary approach and beyond. ICES J. of Mar. Sci., 71: 166–172. doi:10.1093/icesjms/fst146
LUDWIG, D., and C. J. WALTERS. 1981. Measurement errors and uncertainty in parameter estimates for stock and recruitment. Can. J. Fish. Aquat. Sci., 38: 711–720. doi: 10.1139/f81-094
MACE, P. M., and I. J. DOONAN. 1988. A generalised bioeconomic simulation model for fish population dynamics. New Zealand Fishery Assessment Research Document, 88/4.
MANGEL, M., J. BRODZIAK, and G. DINARDO. 2010. Reproductive ecology and scientific inference of steepness: a fundamental metric of population dynamics and strategic fisheries management. Fish and Fisheries, 11: 89–104. doi: 10.1111/j.1467-2979.2009.00345.x
MANGEL, M., A. D. MACCALL, J. BRODZIAK, E. J. DICK, R. E. FORREST, R. POURZAND, and S. RALSTON. 2013. A perspective on steepness, reference points, and stock assessment. Can. J. of Fish. Aquat. Sci., 70: 930–940. doi: 10.1139/cjfas-2012-0372
MCALLISTER, M., and D. E. DUPLISEA. 2012. Production model fitting and projection for Acadian redfish (Sebastes fasciatus) in Units 1 and 2. DFO Can. Sci. Advis. Sec. Res. Doc., 2012/103, 34 p. http://www.dfo-mpo.gc.ca/Csas-sccs/publications/resdocs-docrech/2012/2012_103-eng.pdf
MILLER, D. C. M., and P. A. SHELTON. 2010. “Satisficing” and trade-offs: evaluating rebuilding strategies for Greenland halibut off the east coast of Canada. ICES J. Mar. Sci., 67: 1896–1902. doi: 10.1093/icesjms/fsq08
MORGAN, M. J., K. S. DWYER, and P. A. SHELTON. 2012. Reference points and assessment update for American Plaice (Hippoglossoides platessoides) in NAFO SA2 + Div. 3K and Subdiv. 3Ps. DFO Can. Sci. Advis. Sec. Res. Doc., 2012/152, 64 p. http://www.dfo-mpo.gc.ca/Csas-sccs/publications/resdocs-docrech/2012/2012_152-eng.pdf
MYERS, R. A., G. MERTZ, and P. S. FOWLOW. 1997. Maximum population growth rates and recovery times for Atlantic cod, Gadus morhua. Fish. Bull. US., 95: 762–772.
MYERS, R. A., K. G. BOWEN, and N. J. BARROWMAN. 1999. Maximum reproductive rate of fish at low population sizes. Can. J. Fish. Aquat. Sci., 56: 2404–2419. doi: 10.1139/f99-201
PATRICK W.S., and J. COPE. 2014. Examining the 10-Year Rebuilding Dilemma for U.S. Fish Stocks. PLoS ONE 9(11): e112232. doi:10.1371/journal.pone.0112232
POPE, J. G. 1972. An investigation of the accuracy of virtual population analysis using cohort analysis. Res. Bull. Int. Comm. Northw. Atl. Fish., 9: 65–74.
PUNT, A. E., D. S. BUTTERWORTH, C. L. DE MOOR, J. A. A. DE OLIVEIRA, and M. HADDON. 2014. Management strategy evaluation: best practices. Fish and Fisheries, 17: 303–334. doi: 10.1111/faf.12104.
QUINN, T. J., and R. B. DERISO. 1999. Quantitative fish dynamics. Oxford University Press, New York, 542 p.
RADEMEYER, R. A., É. E PLÁGANYI, and D. S. BUTTERWORTH. 2007. Tips and tricks in designing management procedures. ICES J. Mar. Sci., 64: 618–625. doi: 10.1093/icesjms/fsm050
R CORE TEAM. 2013. R: A language and environment for statistical computing. R Foundation for Statistical Computing, Vienna, Austria. http://www.R-project.org/.
RESTREPO, V. R., and J. E. POWERS. 1999. Precautionary control rules in US fisheries management: specification and performance. ICES J. Mar. Sci., 56: 846–852. doi: 10.1006/jmsc.1999.0546
ROFF, D. A. 1992. The evolution of life histories: theory and analysis. Chapman and Hall, New York, 535 p.
SHELTON, P. A., and D. C. M. MILLER. 2009. Robust management strategies for rebuilding and sustaining the NAFO Subarea 2 and Divs. 3KLMNO Greenland halibut fishery. NAFO SCR Doc., 09/037. http://archive.nafo.int/open/sc/2009/scr09-037.pdf
SHELTON, P. A., and M. J. MORGAN. 2014. Impact of maximum sustainable yield-based fisheries management frameworks on rebuilding North Atlantic cod stocks. J. Northw. Atl. Fish. Sci., 46:15–25. doi: 10.2960/J.v46.m697
STERNS, S.C. 1992. The Evolution of Life Histories. Oxford University Press, London, 249 p.
STONE, H. H. 2012. Biomass reference points for Eastern Component Pollock (4VW+4Xmn). DFO Can. Sci. Advis. Sec. Res. Doc., 2012/27, 11 p. http://www.dfo-mpo.gc.ca/Csas-sccs/publications/resdocs-docrech/2012/2012_027-eng.pdf
TRZCINSKI, M. K., S. L. ARMSWORTHY, S. WILSON, R. K. MOHN, and S. E. CAMPANA. 2011. A framework for the assessment of the Scotian Shelf and Southern Grand Banks Atlantic Halibut stock. DFO Can. Sci. Advis. Sec. Res. Doc., 2011/2, 113 p. http://www.dfo-mpo.gc.ca/Csas-sccs/publications/resdocs-docrech/2011/2011_002-eng.pdf
UN [United Nations]. 1995. Agreement for the Implementation of the Provisions of the United Nations Convention on the Law of the Sea of 10 December 1982 Relating to the Conservation and Management of Straddling Fish Stocks and Highly Migratory Fish Stocks. United Nations Conference on Straddling fish stocks and Highly Migratory Fish Stocks, Sixth session, New York, 24 July–4 August 1995. http://daccess-dds-ny.un.org/doc/UNDOC/GEN/N95/274/67/PDF/N9527467.pdf
WALTERS, C. J. 1985. Bias in the estimation of functional relationships from time series data. Can. J. Fish. Aquat. Sci., 42: 147–149. doi: 10.1139/f85-018
WALTERS, C. J., and D. LUDWIG. 1981. Effects of measurement errors on the assessment of stock-recruit relationships. Can. J. Fish. Aquat. Sci., 38: 704–710. doi: 10.1139/f81-093
WALTERS, C. J., and S. J. D. MARTELL. 2004. Fisheries Ecology and Management. Princeton University Press, Princeton and Oxford, 399 p.
WIEDENMANN, J., M. J. WILBERG, and T. J. MILLER. 2013. An evaluation of harvest control rules for data-poor fisheries. North American Journal of Fisheries Management, 33: 845–860. doi: 10.1093/icesjms/fsr071
WETZEL, C. R., and A. E. PUNT. 2016. The impact of alternative rebuilding strategies to rebuild overfished stocks. ICES J. Mar. Sci., 73: 2190–2207. doi:10.1093/icesjms/fsw073
ZHANG, Y., Y. CHEN, and C. WILSON, C. 2011. Developing and evaluating harvest control rules with different biological reference points for the American lobster (Homarus americanus) fishery in the Gulf of Maine. – ICES J. Mar. Sci., 68: 1511–1524. doi: 10.1093/icesjms/fsr071
|