Introduction
Changes in ocean climate combined with direct and indirect effects of harvesting can dramatically and rapidly alter the composition of marine fish communities (Hutchings and Reynolds, 2004). The global crisis in overexploitation of fisheries has resulted in calls for multispecies or “ecosystem-based” assessment and management of fish stocks and assemblages (Jennings and Kaiser, 1998, Pauly et al., 2002, Worm et al., 2009). An ecosystem approach to fisheries management in marine waters has long been advocated to gain a better understanding of the structure and functioning of ecosystems and to eventually restore and sustain them (Tolimieri and Levin, 2006). A first step towards ecosystem management is to reduce the complexity of the ecosystem and search for patterns by describing species abundance and distribution to identify species assemblages and the biological and environmental conditions associated with these assemblages (Mahon and Smith, 1989; Gomes et al., 1992; Tolimieri and Levin, 2006). Implementation of multispecies approaches requires improved understanding of the community ecology of fish assemblages, but this information has rarely been explicitly incorporated into management practices. Although single-species management is still commonly practiced, in recent decades, numerous papers have described demersal fish assemblages: in tropical areas (Bianchi, 1991); in the Scotian Shelf and the Gulf of St Lawrence (Bundy, 2005); Norwegian Sea (Lekve et al., 1999); in the Mediterranean Sea (Moranta et al., 1998); in the NW Iberian Peninsula (Fariña et al., 1997); off the East coast of North America (Mahon et al., 1998; Tolimieri and Levin, 2006); off the West coast of North America (Cope and Haltuch, 2012); in the mid-Atlantic (Azores Archipelago-Menezes et al., 2006). Mahon and Smith (1989) identified ten offshore assemblages of relatively similar species composition on the Scotian Shelf and Bay of Fundy, from 1970 to 1981; in the Flemish Cap (NAFO Div. 3M) three main assemblages were identified (Paz and Casas, 1996; González-Troncoso et al., 2006); Villagarcía (1995) studied the structure and distribution of demersal fish assemblages on the Northeast Newfoundland and Labrador Shelf; Gomes et al. (1992) found six assemblages over 16 years (1971–1982, 1984–1987) on the Grand Banks of Newfoundland.
Rose (2003) provides an overview of the fisheries resources and science in Newfoundland and Labrador. The Southern Grand Banks (NAFO Div. 3NO), part of the Labrador Newfoundland Large Marine Ecosystem (Fig.1), is an internationally known fishing ground most noted for cod, but haddock, redfish, flatfish (including halibut), mackerel and herring are also caught. There was a rapid expansion of distant water fleets during the late 1950s, as well as an intensification of fishing effort. This has affected the major fish stocks of the shelf. Overfishing of Atlantic cod, haddock, redfish and major flatfish in the 1960s and 1970s led to fisheries collapses. In 1977, fishing by foreign fleets was reduced with the establishment of Canada's 200 nautical mile exclusive economic zone (Pinhorn and Halliday, 1990). The fishing effort of Canadian fishing fleets increased in the 1980s. A general stock decline led to a second phase collapse, 1985–1993 (Kennet et al., 2004). In 1992, the collapse of cod stocks led to the imposition of a moratorium on fishing cod over most of the Newfoundland and Labrador banks, including the Grand Banks. Some limited fishing was resumed in 1998, but almost all cod stocks are still at very low levels and have not yet recovered. The collapse of Newfoundland’s Northern cod fishery in 1991–92 coincided with unusual ice conditions and a broadening of the cold intermediate layer of the Labrador Current. This coincidence fueled speculation that cold water had killed or driven out the cod (Young and Rose, 1993). In some quarters, the speculation was hopeful: perhaps nature, and not overfishing, was to blame for this ecological disaster. But on finer scales, the cold water distribution appeared patchy, and even at its greatest extent, there remained vast areas still suitable for cod (Haedrich and Barnes, 1997). Careful analysis reached the conclusion that overfishing alone best explains the Northern cod collapse (Hutchings and Myers 1994, 1995; Sinclair and Murawski, 1997). Cold water could have facilitated overfishing, however, by concentrating the cod and making them easier to catch (Martin, 1995). After the collapse of traditional demersal fisheries, fishermen adapted by pursuing alternative species, often invertebrates such as lobster, crab and shrimp (some of which had once been the prey of groundfish). In the 1970s, shellfish comprised less than 5% of Newfoundland’s landings by weight, and just over 10% by value. After the 1992 codfish collapse, shellfish landings climbed steeply. By 1995 shellfish accounted for 64% of Newfoundland’s landings by weight and 89% by value (Hamilton and Haedrich, 1999).
|
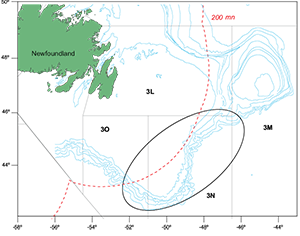
Fig. 1. Chart of the Grand Banks NAFO Div. 3LNO. Spanish bottom trawl area in NAFO Regulatory Area, Div. 3NO, is marked by the ellipse.
|
A Spanish bottom-trawl fishery has been developed along the continental slope to the East of the Grand Banks of Newfoundland. This area fits within the one that has normally been used by the Greenland halibut fishery (González-Costas and González-Troncoso, 2009). Since 2001, the distribution of the Greenland halibut fishery has been quite consistent (for further details on the evolution of the fishing effort distribution, see González-Troncoso et al., 2007). Different fisheries were conducted in the period 2005–2011 in NAFO Div. 3NO depending on the target species, area, depth and gear (mesh size). One is a mixed fishery with demersal 130 mm mesh size at depths less than 200 m with different catch composition in Div. 3N (56% American plaice, 26% yellowtail flounder, 10% cod and 6% skates) than in Div. 3O (57% redfish, 14% American plaice, 12% skates and 7% witch flounder). In Div. 3NO, with 280 mm mesh size at less than 200 m depth, the target species was skate (63%), with American plaice (19%), yellowtail flounder (10%) and cod (6%) as main bycatch species (González-Costas, 2012).
With the extension of deep-sea fisheries, there has been increased interest in the ecology of deep-sea species (Priede et al., 2010). Previous studies have examined the fish assemblages on the Grand Banks. These studies, however, covered limited depths (Gomes et al., 1992), were spatially limited (Snelgrove and Haedrich, 1985), or used sampling techniques that limit the biodiversity of the catch (e.g., long-lining (Murua and Cárdenas, 2005)). Moreover, they are not current (Gomes et al., 1992) and, therefore, unable to detect potential temporal changes in assemblage structure in recent years.
The Spanish Administration has performed a bottom trawl survey on the Southern Grand Banks since 19951 (NAFO Regulatory Area Div. 3NO) (Fig. 2) (Paz et al., 2002). Here, we use data from this survey to examine biomass distribution, to describe the assemblage structure of the dominant fish fauna in the Southern Grand Banks during the period 2002–2011, and to explore the possible changes that have taken place in the communities over this period, including species composition and interaction as well as depth distribution and diversity. This study was intended to identify, describe and map broad groundfish assemblage areas over a wide depth range (38–1460 m), further expanding on previous works in the area. Specifically, we (i) extend the bathymetric range for the identification and description of fish assemblages; (ii) determine whether the species assemblages of demersal fish follow similar depth patterns in temporal scale in the area; and (iii) ask whether there were any changes in the dominant species in each assemblage.
|
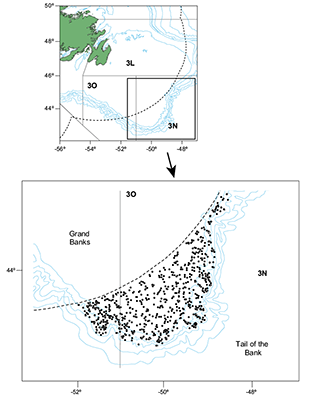
Fig. 2. Hauls position in the Spanish Spring Survey in Div. 3NO in the whole period (2002‒2011).
|
Materials and Methods
Material
We used data from the Spanish Survey conducted by the Instituto Español de Oceanografía (IEO) to estimate abundance and biomass of demersal resources in the Div. 3NO of the NAFO Regulatory Area. This survey has been carried out every year since 1995 in late spring (May–June). From 1995 to 2001, it was conducted on board the CV Playa de Menduiña using the Pedreira–type net, and, since 2002, the RV Vizconde de Eza has replaced the former vessel in conducting surveys using a Campelen bottom trawl. In 2001, a comparative survey between the two vessels was made in order to transform the historic time series into the new vessel index, making 92 paired hauls. The survey indices of the most important species were transformed to use the whole time series in the assessments of these species. For details of the indices transformation, see Paz et al. (2002). In this study species that are not usually assessed have been used, although the transformation of their indices is not available. For this reason we used data from 2002 to 2011 (Table 1). Hauls were made following the stratification charts described in Bishop (MS 1994). Sets were allocated in accordance with the area of the strata, with a minimum of two planned hauls per stratum. Trawl positions were chosen randomly. Abundance and biomass for all species were estimated by the swept area method (Cochram, 1997). The sampling unit consisted in 30-minute hauls at a speed of 3.0 knots using a Campelen 1800 otter trawl gear. The mesh size was 44 mm for the net and 12 mm for the cod end. The mean horizontal opening was 26 m and the vertical opening was 4.1 m. The otter trawl was monitored using a Scanmar net control system. For temporal series details see Paz et al. (2002). Around 120 valid hauls are made each year. In each haul all the individuals caught are systematically sorted by species and the length distribution is obtained (González–Troncoso et al., 2004). The mean of the initial and final depth has been used to define the bottom depth of each haul. The mean depth varies from 38 to 1460 m. A total of 1160 hauls were made in the survey between 2002 and 2011 (Table 1 and Fig. 2).
We included the 28 most abundant species in the survey in our analyses: 26 demersal species, one pelagic species (capelin, Mallotus villosus) and one mesopelagic genus (redfish, Sebastes spp.)2 were included (Table 2). They consisted of commercial and non-commercial species, but they were potentially dominant species in a given region or potential forage for other species. These 28 species amounted to 92.64% of the total catch of the survey. All species were present at least in 6.29% of the total observed tows. A complete list of species considered in this study is given in table 2.
Methods
Before determining groundfish assemblages, some exploratory analysis were conducted to examine if zonation existed, how species were distributed by depth and where depth boundaries existed. The chi-square test, as described by Gardiner and Haedrich (1978), was used for a preliminary investigation of zonation. An analysis of box-plots was performed in order to have an initial descriptive statistical analysis of catches by depth. To describe semi-quantitative trends in biomass with depth, we constructed graphs of the cumulative distribution of the catches and compared with the empirical cumulative distribution of the depths of the hauls. Finally, in order to quantify zonation, the potential boundaries of depth were examined by calculating the percentage similarity (PS) between the regions involved. Then multivariate analyses were conducted to identify species assemblages. We used cluster analysis to confirm the boundaries found in the PS analysis. Two other multivariate analyses were used in order to confirm the cluster analysis results and to determine which species make up each assemblage: Correspondence Analysis (CA) and Principal Component Analysis (PCA). To investigate the structure within each community and possible changes, we calculated the index of diversity, the total biomass and the CPUE, and the percentage of the total biomass and occurrence for dominant species found in each group resulting from these analyses. Since most of these species co-occur in several assemblages, we explored size depth trend or bigger-deeper phenomenon of some species. Regression on individual species was performed to establish whether a correlation between size and depth of occurrence existed.
The surveyed area outside the EEZ does not completely cover the species distribution in the area, especially on the continental shelf. Therefore, although the sampling in the shallow zone can be considered significant in terms of the specific catch composition or weight of the species present in it, their relative composition could vary if the total area of the continental shelf is considered. Moreover, bottom trawls are both species and size selective, and it is impossible to adjust this type of selectivity without knowing the behaviour of most species or the real age/size structure of populations.
The chi-square test (Gardiner and Haedrich, 1978) was applied to the presence or absence of the species. Bottom trawl hauls available were arranged in order of increasing depth, and the area studied was arbitrarily divided into 10 depth regions of 150 m depth ranges (≤150 m, 151–300 m, 301–450 m, 451–600 m, 601–750 m, 751–900 m, 901–1050 m, 1051–1200 m, 1200–1350 m, ≥1351 m). The number of species that appeared for the first time in each region (upslope boundaries) was recorded. This method tests the distribution across the area of upslope boundaries using the formula:
 with Q-1 degress of freedom with Q-1 degress of freedom
where:
Q = number of regions into which the area was randomly divided
K = total number of species
V = sum of squares over all regions of the number of upslope boundaries
The null hypothesis is that the locations of upslope boundaries are uniformly distributed along with the gradient and that there is no tendency towards clustering.
An analysis with box-plot graphs was performed in order to determine the percentiles of the catches by depth. In the box-plot graphs, catches were represented as a function of depth by haul. For identifying associations between catches of the representative species and bottom depth, we characterized the general frequency distribution of the habitat variable (depth) by constructing its empirical cumulative distribution function (cdf). Commonly, the probability associated with each observation in a cdf is 1/n, but the stratified random survey design results in a probability of 1/nh within each stratum. However, the stratification can be ignored when the allocation of sets is strictly proportional to stratum size (Perry and Smith, 1994). If there were no clear association between fish distribution and depth within the area surveyed, then the cumulative distribution function for each species would be almost identical to the function for depth. Conversely, when the fish were associated with a small depth range, these functions would be very different.
In order to quantify the zonation, the potential boundaries suggested by the patterns in the cumulative curves were examined by calculating PS between the regions involved. PS was calculated between each region of 150 m intervals up to 1050 m and the regions between 1051 m and 1460 m with the boundary at 1200 m. PS is a commonly-used measure of faunal overlap and was calculated following the formula of Whittaker and Fairbanks (1958):

where:
Pia= the proportion observed by species i in sample a
Pib= the proportion observed by species i in sample b
It is known that PS is not sensitive to sample size, but highly sensitive to the relative number of species among the regions involved. So, for example, if the sample size varies excessively among strata and the species number is closely related to sample size, it will lead to a downwardly biased perception of affinities among strata (Koslow, 1993).
We conducted cluster analysis to identify species assemblages and to confirm the boundaries found in the PS analysis. One of the more common types of cluster analysis, tree clustering, was employed. This method uses the dissimilarities or distance between objects when forming the clusters, in which samples were arranged into groups with a similar biotic composition (Clifford and Stephenson, 1975). As the number of hauls (1160) would make interpretation difficult, we grouped into a 150 m depth bin for every two years. These class depths or strata were labelled with the maximum depth value of the class. Therefore, for every two years (2002–2003, 2004–2005, 2006–2007, 2008–2009, 2010–2011) there were 10 strata named: 150, 300, 450,…, 1350, 1500, resulting in a total of 50 strata. The mean number of specimens per strata for each species was root-root transformed (x1/4)to dampen the influence of abundant species (Field et al., 1982). We use Bray-Curtis similarity, which ignores joint absences that are common in marine survey data where many of the species are absent from the majority of the samples (Field and McFarlane, 1968). Moreover, with the root-root transformation and the Bray-Curtis measure, the similarity coefficient is invariant to a scale change (Stephenson and Burges, 1980). The dissimilarity matrix of the data was calculated in R (R Development Core Team, 2011) and cluster analysis was carried out using Statistica (Statsoft Inc., 1998).
In order to confirm the results of the cluster analysis and to describe which species make up each assemblage, two more multivariate techniques were used, Correspondence Analysis (CA) and Principal Component Analysis (PCA). There are other ordination methods that were developed specifically for ecological data (Ter Braak, 1986; Zuur et al., 2007) and have been used successfully in other studies of demersal fishes (e.g. Bianchi, 1992). We used PCA to facilitate the comparison with previous works in near areas (Mahon, 1998; Lorenzo, 2011). Species loadings on the principal components (PCs) were used to identify groups of species that tend to co-occur (i.e. assemblages). Previous analyses have shown that ubiquitous species may be a member of more than one assemblage, and PCA allows a species to be associated with more than one component. The PCs with eigenvalues >1 are considered to represent statistically significant assemblages (Jolliffe, 1986). VARIMAX rotation was used for the PCs having eigenvalues >1 in the unrotated PC extraction (Jolliffe, 1986). Every assemblage can potentially be present at every site, as the assemblages are not mutually exclusive in space. The data and the transformations used in these analyses were the same as those used in the cluster analysis and were performed by Statistica program.
To examine changes in the structure and composition of the groundfish species assemblage, for each assemblage described, the index of diversity (Shannon and Weaver, 1963), the total biomass and the CPUE, and the percentage of the total biomass and occurrence for the dominant species found were calculated. The Shannon–Wiener index is sensitive both to the number of species and to their relative abundance. A high value of diversity will occur with a high number of equally abundant species, a low value with a low number of species and a species composition dominated by one or a few species.
The “bigger-deeper” phenomenon, in general, refers to the distinct trends in body size over environmental gradients. As a general rule, there is a positive relationship between size and depth. Intra-specific bigger-deeper trends have been identified in Collins et al. (2005) and in previous works (e.g. Macpherson and Duarte 1991). To analyze the bathymetric trends of demersal fishes, regressions on individual species were performed. Size was estimated from the mean weight of the species at each set.
Results
A total of 938 201.77 kg was caught during the 10-years time series (2002–2011), of which 877 874.44 kg were fishes, corresponding to the 93.56% of the total capture, and representing 240 taxa (221 fish species) belonging to 86 families. Species were caught in depths between 38 to 1460 m. The highest catch corresponded to redfish. The most present species (% occurrence) was American plaice. Over the last few years of the studied period, the estimated indices for yellowtail flounder and redfish increased (Fig. 3). In 2011, Atlantic cod and American plaice continued to be below historical levels.
|
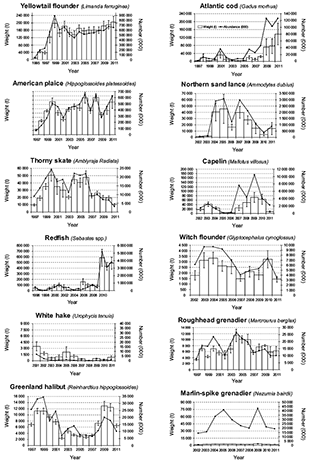
Fig. 3. Abundance and Biomass estimates for the main species from Spanish bottom trawl survey 3NO, 2002–2011
|
Fish species were not randomly distributed across depths(x2 = 21.67, df = 9, p < 0.01), and showed three different patterns of distribution in relation to depth (Fig. 4). Some species presented a limited shallow distribution (e.g., yellowtail flounder, sea raven, Northern sand lance, capelin, moustache sculpin, Atlantic wolfish). Other species presented wider bathymetric distribution (e.g. witch flounder, Northern wolfish). The rest of the species were restricted to a deep range distribution (e.g. black dogfish, Arctic skate, rat fish). Median depth was less than 300 m for 14 species, between 301 and 1000 m for eight species, and deeper than 1001 for six species.
|
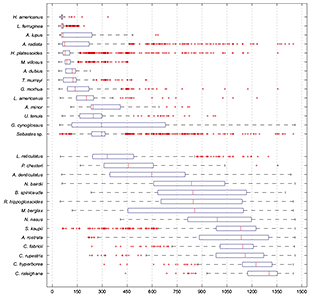
Fig. 4 Box-Plots of depth distribution of the most abundant species caught in the deep water trawl survey in NAFO Div. 3NO, 2002–2011. Median and quartiles were represented. Species graphs were ordered by increasing median depth catches value so we observed an increasing gradient of depth for each one.
|
Second analysis was made via empirical cumulative distribution functions for observed depth and depth weighted by the biomass of specimens caught of each species. It was observed that species presented different behaviour with respect to depth. Species appeared divided into three main groups. Some species presented a distribution above the function for depth; those species presented cumulative occurrence percentages higher than 80% in depths less than 300 m. Cumulative distribution of those species was plotted in Fig. 5, group A (Shallow). Other species showed no particular association between fish distribution and depth within the area surveyed. This group comprised species with very different behaviour and variability in a wide range of depth (Fig. 5, group B (Intermediate)). One species, witch flounder, had a random distribution in terms of the depth. Other species presented a distribution below the function for depth, with a cumulative occurrence percentage higher than 80% in depths greater than 1001 m (Fig. 5, group C (Deep)).
|
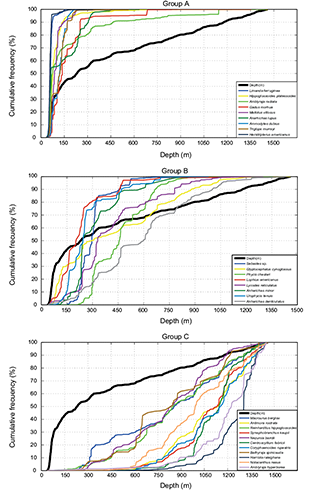
Fig. 5. Cumulative frequency distribution of habitat variable (bottom depth and catch data from the Spanish bottom-trawl survey: 2002–2011 NAFO Div. 3NO).
|
Percentage similarities for each depth boundary were given in Table 3. All PS boundaries values were higher than 50% except 150 m and 600 m. These results suggested weak zonation at these boundaries.
A cluster analysis was performed to contrast these results. The examination of the dendogram revealed the existence of five groups associated with the continental shelf and the slope (Fig. 6). Cluster I and II (Shallow or “Continental Shelf”) comprised the strata with depths lesser than 150 m and between 151 and 300 m; cluster III (Intermediate or “Upper Continental Slope”) contained the depth strata between 301 and 600 m, cluster IV (Deep or “Medium Slope”) the depth strata between 601 and 1000 m and Cluster V (Deep or “Lower Slope”) the depths greater than 1001 m. In agreement with the PS, the dendogram indicated less zonation at the boundaries of 150 m and 600 m because the boundaries in these depths appeared at a low level of dissimilarity (37% and 28% respectively).
|
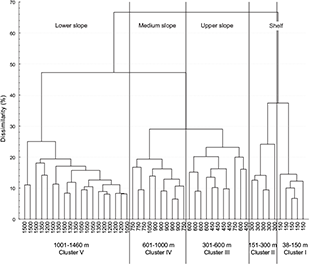
Fig. 6. Dendogram showing the classification of 1160 sets grouped in 10 depth class of 150 m by two years (2002–2003, 2004–2005, 2006–2007, 2008–2009, 2010–2011) based on mean abundance of fish fauna species composition by depth class. Catch was root-root transformed before comparing stations using the Bray-Curtis measure, and the dendogram formed by group-average sorting. Five clusters are distinguished.
|
Correspondence Analysis (Fig. 7) showed five different groups in agreement with the five clusters of the dendogram. In the Principal Components Analysis (Fig. 8), the first three principal components accounted for 84% of the variation in fish assemblage structure (and had eigenvalues >1.0, Table 4), with the first two components accounting for more than 79%. We found five groups of species, which were the same as in the CA.
From these analyses, five assemblages appeared: Shallow assemblages comprised first Shelf Group I (comprising sets shallower than 150 m) and second Shelf Group II (comprising sets between 151 and 300 m); Intermediate assemblage (Upper Continental Slope) Group III, comprising sets between 301 and 600 m; Slope Group IV between 601 and 1000 m and Deep assemblage (Continental Slope) Group V, comprising sets deeper than 1001 m. The three main groups: Shallows, Intermediate and Deeps agree with the three different patterns found in the cumulative distribution.
|
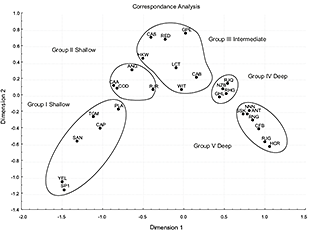
Fig. 7. Data on species assemblages and distribution from Southern Grand Banks in 2002–2011, all years combined. Correspondence Analysis ordination plot of axes I and II relating abundance variations to the depth range: 38–1460m. Hauls number: 1160.
|
Yellowtail flounder, American plaice, Northern sand lance, moustache sculpin, capelin and web sculpin formed the first assemblage (Group I, Shallow). The second assemblage (Group II, Shallow) comprised the Atlantic cod, American angler, wolfish and thorny skate. Redfish, spotted wolfish, Arctic eelpout, Northern wolfish, white hake, longfin hake and witch flounder were included in the third assemblage (Group III, Intermediate). The fourth assemblage (Group IV, Deep) comprised four species: marlin spike, spinytail skate, Greenland halibut and roughhead grenadier. Box-Plot graphs and cumulative distribution graphs also defined these subgroups: species that had the same medians and their curves were separated from the others, showing a very similar distribution. They followed a wide distribution, mainly deep. Snubnosed spiny eel, blue antimora, Northern cutthroat eel, roundnose grenadier, black dogfish, Arctic skate and longnose chimera formed the fifth and deepest assemblage (Group V, Deep).
|
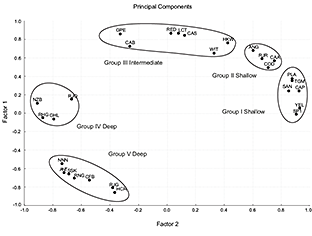
Fig. 8 Data on species assemblages and distribution from Southern Grand Banks in 2002–2011, all years combined. Principal Components Analysis ordination plot of axes I and II relating abundance variations to the depth range: 38–1460m. Hauls number: 1160.
|
Tables 5 and 6, respectively, show the most abundant demersal species (as a percentage of total biomass) percentage of occurrence and the index of diversity in the five depth zones considered and the overall community parameters. The highest value is reached in the deeper assemblage, with diversity H = 2.23.
In assemblage I, yellowtail flounder and American plaice were dominant with an occurrence higher than 85%; redfish was the dominant species in assemblage II with a very high proportion of biomass in comparison with the proportion of others species in the same group. In this assemblage, Atlantic cod and American plaice had a very high occurrence, more than 89%, although their percentage of biomass is very low (less than 10 times redfish biomass). In group III, redfish was also the dominant species in terms of biomass but Greenland halibut and marlin spike had an occurrence higher than 91%. In assemblage IV, Greenland halibut and roughhead grenadier were the dominant species. In group V, blue hake was the dominant species, although Northern cutthroat eel and roughhead grenadier reached similar biomass and occurrence values.
In general, the most important and present taxon was redfish. Although the species number was similar in the five groups, redfish biomass was very high in the assemblages II and III, whereas the proportion of species was most homogeneous in deeper assemblages (III and IV). For those reasons biodiversity index was higher in deeper groups (Table 6).
Some species like marlin-spike and Greenland halibut showed a well marked “bigger-deeper” distribution (Table 7). Blue hake showed less marked length dependent distribution. One species, Glyptocephalus cynoglossus, showed a significant negative correlation.
Discussion
We found a strong association between the assemblage structure of groundfishes and depth. Analysis of 10-years from the Spanish trawl surveys data collected in the South of the Grand Banks of Newfoundland (NAFO Regulatory Area) identified five main assemblages that varied in their depth characteristics. The five groups obtained in the cluster analysis (Fig. 6) can be associated with the shelf (Groups I and II, between 38 and 300 m), upper slope (Group III, between 301 and 600 m), the middle slope (Group IV, between 601 and 1000 m) and lower slope (Group V, below a depth of 1001 m).
Species richness
The 240 taxa caught from 86 families represented a bigger fish fauna diversity than the 137 fish taxa identified on continental slopes in New Zealand along a depth gradient from 50 to 1200 m (Zintzen et al., 2012), the 39 fish species caught in bottom trawls on the Newfoundland continental slope at depths from 204 to 2345 m near Carson Submarine Canyon (Snelgrove and Haedrich, 1985), and the 82 species collected off the Balearic Islands (Moranta et al., 1998). Diversity was similar to that of the Gulf of Tehuantepec (Mexico) and the Gulf of Papagayo (Costa Rica) where surveys caught 230 species (Bianchi, 1991), and the Eastern North Pacific where 265 individual fish taxa were identified on the U.S. West coast groundfish bottom trawl survey between 2003 and 2010 (Keller et al., 2012). However, it represents only 71% of the 310 fish species obtained in 1991 in depths between 200 and 1400 m in the continental slope off western Australia during a demersal trawling survey, and between 1989 and 1991 during commercial fishing operations (Williams et al., 2001).
Changes in species composition
According to Spanish surveys in the NAFO Divisions 3NO, the biomass and abundance of the main commercial species showed a change since 1995 when the surveys started (Fig. 3). About twenty years after the moratorium, even some important commercial species (e.g. Atlantic cod and American plaice) showed some signs of recovery but did not reach their historical levels from before the collapse. Yellowtail flounder increased above their previous historical levels and redfish showed a large variability, although its surveys biomass index has been increasing since the mid-2000s. Some similar signs over the last few years appeared in Flemish Cap, which is close to the studied area. For instance, the Atlantic cod increased, redfish reached very high biomass levels and only American plaice maintained the depressed situation (Casas and González-Troncoso, MS 2011). Major changes in the abundance of the dominant species (cod, American plaice) have led to modification in species composition of demersal assemblages.
Depth patterns and species distribution
Most of the studies on demersal fish assemblages have indicated that the main faunal changes occur along the depth gradient, so depth is the factor which most influenced the distribution of the species (Murua and De Cardenas, 2005; Bianchi, 1991; Moranta et al., 1998; Labrapoulou and Papaconstantinou, 2004; Tomilieri and Levin, 2006). Changes in relation to depth were probably related to change in temperature and oxygen levels (Tomilieri and Levin, 2006). Physical characteristics of water masses, as well as bottom type, light intensity, pressure, etc., are mostly depth-dependent, and depth obviously reflects the combined effects of these factors (Bianchi, 1991). Most of the species present a wide range distribution, but they tend to be dominant in a given depth. Despite the collapse of species, some among them maintained a wide bathymetric range and we even observed an increase in this range for the main commercial species. Snelgrove and Haedrich (1985) found that Atlantic cod occupied depths ranging from 204 to 307 m in the Carson Submarine Canyon, and Gonzalez-Troncoso et al. (2006) found depth range from 126 to 343 m for the same species in Flemish Cap. In our analysis, we found that this species occupied very wide depths, from 40 m to 1455 m. For Greenland halibut, a typical deep species, a wide depth distribution was found, from 43 m to 1449 m (maximum depth surveyed). Similar findings were observed by Murua and De Cardenas (2005) with a depth range from 200 to 2000 m combining results from different surveys carried out in the NAFO Area, and Casas and González-Troncoso (MS 2011) found this species in all the depth ranges surveyed (120 to 1400 m) in Flemish Cap. Even in the species that presented a wide range distribution, catch was concentrated around a strictly depth range, shallow or deep in most cases (Fig. 4).
|
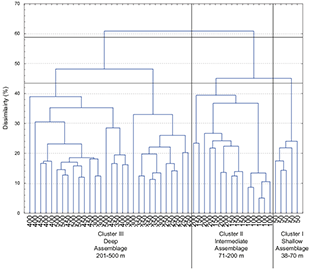
Fig. 9 Dendogram showing classification of 773 sets grouped in 10 depth class of 50 m over two years (2002–2003, 2004–2005, 2006–2007, 2008–2009, 2010–2011) based on mean abundance of fish fauna species composition by depth class. Catch was root-root transformed before comparing stations using the Bray-Curtis measure, and the dendogram formed by group-average sorting. Three main clusters are distinguished at an arbitrary dissimilarity level of 44%.
|
González-Troncoso et al. (2006) and Paz and Casas (1996) found a strictly shallow distribution for American plaice, Atlantic cod and wolffish in Flemish Cap. This is consistent with our results. Other species such as black dogfish and longnose chimera showed a strictly deep distribution, as reported by Murua and De Cardenas (2005).
Along with this we also observed that some species, as American plaice, considered strictly shallow, showed a large range of occurrence. The same case was observed by Iglesias et al. (1996) with information of catches in 1991 and during the second half of 1990 as well as in years 1992 and 1993 collected by observers on board the Spanish trawl fleet in Divs. 3LNM from the Regulatory Area of NAFO. American plaice presented a record occurrence in depths greater than the limits observed in the literature (deepest occurrence at over 1400 m).
Fish assemblages
Five assemblages were distinguished to which we can apply qualitative depth description. The boundaries established in 300 m and 1000 m by the cluster analysis coincide with zones with a higher Percentage of Similarity index (86.9% in 300 m and 85.89% in 1050 m). The most important boundary for all areas was located around the depth separating the species of the continental shelf from those of the upper slope (300 m). The main determining feature associated with the structure of the demersal fish assemblages is depth, as it reflects the changes from continental shelf to continental slope (Labropoulou and Papaconstantinou, 2004). PS in the boundaries at 150 and 600 m was low and suggested little zonation; this was confirmed by the low level of dissimilarity in the cluster analysis. For the general zonation pattern, five groups (Shallow, Intermediate and Deep) were identified. Even if our study analysed a mayor deep range boundaries and species composition were similar to those found in the previous studies in this area (Gomes et al., 1992) and in Flemish Cap (González-Troncoso et al., 2006). Cope and Haltuch (2012) also found persistence of assemblages through time in the west coast of U.S. even under fishing pressure and variable environmental conditions that suggests predictable relationships between species.
In the area of the Grand Banks of Newfoundland, different fish assemblages at depths from 40 to 500 m have been described by Gomes et al. (1992). Similar fish assemblages were also defined by Paz and Casas (1996) and González-Troncoso et al. (2006) in Flemish Cap. Although bathymetric ranges in those studies were different and dramatic changes in abundance and biomass of species caused changes in dominant species of assemblages, we observed a persistence in the main features of the assemblages over the time.
Species assemblages’ composition
We observed changes in dominant species composition in each assemblage over time, especially for American plaice, Atlantic cod and thorny skate when comparing our results with assemblages found by Gomes et al. (1992). In that paper, the authors analysed data from stratified-random groundfish Spring surveys in most of the whole Grand Banks, in NAFO Div. 3LNO, in a previous period (1971–82, 1984–87) to the second collapse of the Atlantic cod stocks (Rose, 2003; 2005). In our shallower assemblage (depth less than 150 m) yellowtail flounder was the most dominant species, while Gomes et al. (1992) found American plaice as the dominant species both in depths less than 70 m and in depths less than 200 m. Boundaries for our second and third assemblages were in 300 m and 600 m, and a similar approach could be found in Flemish Cap, near to Grand Banks, by Paz and Casas (1996) and González-Troncoso et al. (2006). The latter found boundaries between 300 and 500 m, and Paz and Casas (1996) between 300 and 600 m.
Dramatic decreasing on biomass of traditional target species for commercial fishing in the area, such as Atlantic cod and American plaice, can be a cause of changes in the composition of assemblages (Hutchings, 2000; González-Troncoso et al. 2006). In our assemblages, a huge increase of biomass catch for redfish, probably due to the constant decrease of its main predator species, like cod, can be observed. A similar situation occurred in Flemish Cap, where Paz and Casas (1996) and González-Troncoso et al. (2006) found (1992–94 and 1995–2002) that redfish was the dominant species in depths less than 300 m and in depths between 301 and 500 m. The reduction of Atlantic cod abundance and distribution on the eastern Scotian Shelf, where it had historically been the dominant piscivore, may have permitted one or more of its preys or competitor species to increase in abundance and thereafter impacting the recovery of Atlantic cod (Fisher and Frank, 2004). Thus, we appreciated that Atlantic cod was the second dominant species for Gomes et al. (1992) in their Shallow, Intermediate and Deep Assemblages. In our first and second assemblage, Atlantic cod represented only around 8% of the catch.
Regarding the fourth assemblage (600–1001 m), three species appeared as dominant in similar magnitudes: Greenland halibut, redfish and roughhead grenadier. In a more restricted range, off Flemish Cap, González-Troncoso et al. (2006) found that marlin spike was the dominant species. In depths greater than 1001 m blue hake, Northern cutthroat eel and roughhead grenadier had a similar importance with catch resulting in 19.5%, 16.9% and 16.5% respectively, and each one had a 95% of occurrence.
In order to compare with the assemblages found by Gomes et al. (1992) in the Grand Banks, we carried out a cluster analysis considering the depth range truncated in 500 m. Fig. 9 shows the cluster results where we took into account only samples between 38 and 500 m. No changes in assemblage boundaries were found. In the resulting dendogram three similar main zones found by Gomes et al. were distinguished: Shallow assemblage at depths of less than 70 m, Intermediate assemblage at depths between 71 and 200 m and Deep assemblage at depths greater than 201 m. Yellowtail flounder is the most abundant species at depths of less than 70 m in our case, for Gomes et al. (1992) was the American plaice.
On the slope, the assemblage species composition was similar to the results of the recent by catch study in the Greenland halibut fishery (Patrocinio and Paz, 2011). Although the methodology is not comparable, their results can be considered indicative. A total of 51 taxa were identified in the discarded catch, 38 of which accounted for less than 0.5%. Discarded biomass represented 4.3% of the total catch. Discards composition was dominated, in biomass, by the macrourids; roughhead grenadier, marlin spike and roundnose grenadier, which together accounted for 61.2% of the total discarded biomass. The fourth species was blue hake. At depth ranges between 601 and 1460 m we found that Greenland halibut, redfish, roughhead grenadier, blue hake and Northern cutthroat eel were the main species. The presence of redfish and Northern cutthroat eel could be explained by the large difference in gear selectivity as trawl surveys used the Campelen gear, with vertical opening greater and mesh size much smaller than the gear used in fishing activities.
On the other hand, changes in dominant species in the different assemblages, redfish replacing Atlantic cod and American plaice, were observed. A similar pattern presented between Southern Grand Banks and Flemish Cap in the evolution of these fish assemblages indicates that changes in fish populations in the Northwest Atlantic have been produced on a large scale, affecting Large Marine Ecosystem, and not limited to specific areas.
In Icelandic waters, four major species assemblages were identified. Assemblages in the hydrographically stable deep waters North of the country were consistent during the study, while assemblage structure in the more variable shallow waters underwent some changes (Stefansdottir et al., 2010). In our results, similar temporal persistence appears in the deeper assemblages. Despite the fishing effort in the deep waters of the Grand Banks, the overall pattern of demersal fish assemblages remains similar over time. Major changes in the biomass of the species (e.g. cod and American plaice), although affecting the assembly level, do so attenuated and do not substantially alter their general characteristics: range, composition, diversity. Our results confirm the temporal persistence of boundaries and composition fish assemblages in the area. That is in line with the findings of Overholtz and Tyler (1985) and Cope and Haltuch (2012), where assemblages persisted over the long-term and changed spatial configuration only slightly on a seasonal basis.
Diversity
Biomass declined on the middle continental slope; in this region, the diversity was greater than in other zones. This coincides with the results found by González-Troncoso et al. (2006) and Paz and Casas (1996) in Flemish Cap. Magnussen (2002) also found that species diversity increased with depth in two main areas on the Faroe Bank. This fact has an important effect on fish community structure and eventually on the traditional fisheries (Gordon et al., 1994). Commercially important species tend to be present in low diversity communities where they reach a significant proportion in the total biomass (Haedrich, 1994). In line with this assertion, the Shelf and Upper Continental Slope presented the smallest diversity and were the regions where the traditional commercial species exploited in the area, such as Atlantic cod, redfish, yellowtail flounder and American plaice, are present.
In Icelandic waters, Stefansdottir et al. (2010) found that diversity was shown to be highly variable both temporally and spatially, while varying with depth. González-Troncoso et al. (2006) and Paz and Casas (1996) found that representative species from the middle continental slope of Flemish Cap were more homogeneously represented. We also found that catch of different deeper species (forth and fifth assemblage) were more homogeneously represented versus shallower species. However, Menezez et al. (2006) found a marked domination of one or two species in the deepest strata and similar abundance of many species in the shallow depths stratum in Azores. It must be noted that the selectivity of the longline used in their study can reduce the biodiversity of the catch.
The reduction in the biomass of major species fundamentally changed the groundfish community structure and reduced total species biomass by 90% from the 1950s to the 1990s (Casey, 2000). The increase in diversity with fishing pressure was not expected, but can be explained using the intermediate disturbance hypothesis (Huston, 1979). This hypothesis states that in the absence of environmental stress, such as fishing pressure, species diversity would be low as one or more species dominate the community. If the biomass of the dominant species is reduced (i.e. intermediate disturbance), more resources would be made available to other species thus increasing species diversity. In this case, the fishery acts as a keystone predator. Such predators actually facilitate the increase in species diversity by reducing competitive exclusion through species removal (Hacker and Gaines 1990). The removal of cod and haddock allowed flatfish on the Southern Grand Banks to increase in biomass, thus increasing species evenness. The release of resources into the groundfish community may have allowed deepwater species, such as Greenland halibut and eelpout, to move into shallower depths, contributing to the increase in species richness.
Bigger-deeper relation
Targeting large fish that are more valuable is suspected to modify the size structure and the functioning of fish assemblages, with important consequences for productivity and resilience of fish stocks (Gislansson, 2000). Early studies of the demersal deep-sea ichthyofauna indicated a general pattern of increased size with depth (Polloni et al.,1979), which came to be known as Heincke’s Law (following Heincke’s (1913) description of the size of plaice in the North Sea). However, subsequent works demonstrated that the phenomenon was not ubiquitous (Snelgrove and Haedrich, 1985), may be an artefact of sampling (Merrett et al., 1991b) and in some regions a decline in size with depth has been reported (Stefanescu et al.,1992). Collins et al. (2005) provide a clear summary of this issue. Four species in our study show a clear relationship between the size and depth: Greenland halibut, marlin-spike, blue antimora and redfish. All show a very wide range of distribution and the first three are typical depth species. Snelgrove and Headrich (1985) observed a bigger-deeper relation for blue hake and roundnose grenadier. We also found this phenomenon in our analysis for blue hake and Greenland halibut. Wenner and Musick (1977) suggested that blue hake matures in shallow waters, but Snelgrove and Headrich (1985) sampled larger individuals at all depths and immatures could be seen only in shallow samples, creating the appearance of a bigger-deeper relation where it did not exist.
Witch flounder showed a significant negative correlation. Paz and Casas (1996) found the same correlation for this species in Flemish Cap. Burnett et al. (1992) found significant differences in distribution according to depth for juveniles and adults of this species in the Gulf of Maine-Georges Bank Region and, while adults maintained a mean depth constant throughout the year, juveniles were found at shallower depths than adults in winter and spring, and at greater depths in summer and fall. This is attributed to differences in prey distribution associated with differences in the diet (Bunnet et al., 1992).
Understanding the patterns of body size across environmental gradients thus requires an understanding of both the ecology and physiological constraints of the species concerned.
Knowledge of the assemblages of fish can be used to improve the management of multispecies resources exploited, although the definition of assemblages in an area just explains the functioning of the ecosystem. For this reason, it would be necessary to conduct further studies in order to understand the interrelationships between species, such as feeding relationships and trophic guilds.
This study will contribute to the process of moving towards a more holistic approach to fisheries management by reducing the complexity of the Grand Banks ecosystem into fish assemblages that could be used as a possible tool in the management resources.
Conclusions
- Some species on the Grand Banks in the last decade have a wide bathymetric distribution, although they tend to concentrate in relatively restricted depths.
- Despite the decline in abundance and biomass of the main commercial and non-commercial fishes, we observed persistence in the species composition and range of assemblages.
- From the 1980s, yellowtail flounder replaced American plaice and Atlantic cod and becoming the dominant species in shallow assemblages,
- Higher diversity was observed in deeper depths than in shallower assemblages showing an inverse relationship with biomass.
- Assemblage composition persistence and changes in the main dominant species were similar to the changes in near ecosystems such as Flemish Cap.
- The variation pattern in the fish assemblages in the Southern Grand Banks, similar to other Northwest areas, indicates that the changes in fish populations in the Northwest Atlantic have appeared on a large scale and have not been limited to specific areas.
- Not all species considered show a clear relationship between size and depth, although some species, mainly deeper species, exhibit a clear bigger-deeper relation: Greenland halibut, marlin-spike, blue antimora, redfish.
Acknowledgements
The authors would like to thank Lupe Ramilo for her help in obtaining the data and Mar Sacau for her help in the realization of the maps. We are also grateful to José Maria Matías for helping with the Matlab programming language and to two anonymous referees for their constructive comments on the manuscript. A special acknowledgment is also due to the editor for her observations.
References
BISHOP, C. A. 1994. Revisions and additions to stratification schemes used during research vessel surveys in NAFO subareas 2 and 3. NAFO SCR Doc., No. 43, Serial No N2413, 23 p.
BIANCHI, G. 1991. Demersal assemblages of the continental shelf and slope edge between the gulf of Tethuantepec (Mexino) and the Gulf of Papagayo (Costa Rica). Mar. Ecol. Prog. Ser., 73: 121–140. http://dx.doi.org/10.3354/meps073121
BIANCHI, G. and T. HOISATER. 1992. Relative merits of using number and biomass in fish community studies. Mar. Ecol. Prog. Ser., 85: 25–33. http://dx.doi.org/10.3354/meps085025.
BUNDY, A. 2005. Structure and functioning of the eastern Scotian Shelf ecosystem before and after the collapse of the groundfish stocks in the early 1990s. Can. J. Fish. Aquat. Sci., 62: 1453–1473. http://dx.doi.org/10.1139/f05-085
BURNETT, J., M. R. ROSS and S. H. CLARK. 1992. Several biological aspects of the witch flounder (Glyptocephalus cynoglossus (L.)) in the Gulf of Maine-Georges Bank Region. J. Northw. Atl. Fish. Sci., 12: 49–62. http://dx.doi.org/10.2960/J.v12.a2
CASAS, M. and D. GONZÁLEZ-TRONCOSO. 2011. Results from the bottom trawl survey on Flemish Cap of June–July 2010. NAFO SCR Doc. 11/21. Serial No N5904.
CASEY, J. M. 2000. Fish community changes in an Exploited Ecosystem: Newfoundland Southern Grand Bank and St. Pierre Bank, 1951–1995. M.Sc. thesis, Department of Biology, Memorial University of Newfoundland, St. John’s, NL. 111p.
CLIFFORD, H. T and W. STEPHENSON. 1975. An introduction to Numerical Classification. NY: Academic Press, 229 p. COCHRAM, W. G. 1997. Sampling techniques. J. Wiley and Sons, N.Y., 428 p.
COPE, J. M. and M. A. HALTUCH. 2012. Temporal and spatial summer groundfish assemblages in trawlable habitat off the west coast of the USA, 1977 to 2009. Mar. Ecol. Prog. Ser., 451:187–200. http://dx.doi.org/10.3354/meps09595
COLLINS M. A, D. M. BAILEY, G. D. RUXTON and I. G. PRIEDE. 2005. Demersal deep-sea fish differential response in scavenging and non-scavenging. Proc. R. Soc. B., 2005 (272): 2051–2057.
DEYOUNG, B. and ROSE G. A.1993. On recruitment and distribution of Atlantic cod (Gadus morhua) off Newfoundland. Can. J. Fish. Aquat. Sci., 50: 2729–2741. http://dx.doi.org/10.1139/f93-298
FARIÑA A. C., J. FREIRE and E. GONZÁLEZ-GURRIARÁN, 1997. Demersal fish assemblages in the Galician continental shelf and upper slope (NW Spain): spatial structure and long-term changes. Estuarine, Coastal and Shelf Sci., 44 (1997b): 435–454. http://dx.doi.org/10.1006/ecss.1996.0148
FIELD, J. G. and G. MCFARLANE. 1968. Numerical methods in marine ecology. I. A quantitative similarity analysis of rocky shore samples in False Bay, South Africa. Zool. Afr. 3: 119–138.
FIELD, J. G., K. R. CLARKE and R. M. WARWICK. 1982. A practical strategy for analysing multispecies distribution patterns. Mar. Ecol. Prog. Ser., 8: 37–52. http://dx.doi.org/10.3354/meps008037
FISHER, J. A. D. and K. T. FRANK. 2004. Abundance-distribution relationships and conservation of exploites marine fishes. Mar. Ecol. Prog. Ser., 279: 201–213. http://dx.doi.org/10.3354/meps279201
GARDINER, F. P. and R. L. HAEDRICH. 1978. Zonation in the deep benthic megafauna. Application of a general test. Oecologia (Berl.) 31, 311–317. http://dx.doi.org/10.1007/BF00346250
GISLASSON, H., M. SINCLAIR, K. SAINSBURY and R. O. BOYLE. 2000. Symposium overview: incorporating ecosystem objectives within fisheries management. ICES J. Mar. Sci., 57: 468–475. http://dx.doi.org/10.2960/J.v37.m550
GOMES, M. C., R. L. HAEDRICH and J. C. RICE. 1992. Biogeography of groundfish assemblages on the Grand Bank. J. Northw. Atl. Fish. Sci., 14: 13–27. http://dx.doi.org/10.2960/J.v14.a1
GONZÁLEZ-COSTAS, F. 2012. Spanish fisheries in NAFO Subarea 3. NAFO SCR Doc., 12/021, Serial No. N6045.
GONZÁLEZ-COSTAS, F. and D. GONZÁLEZ-TRONCOSO. 2009. Spanish 2006–2008 Fisheries Footprint, scientific observers and surveys coverage and update of the standardized CPUE indices for Greenland Halibut. NAFO SCR Doc., 09/022, Serial No. N5657.
GONZÁLEZ TRONCOSO, D., C. GONZÁLEZ and X. PAZ. 2004. American plaice biomass and abundance from the surveys conducted by Spain in the NAFO Regulatory Area of Divisions 3NO, 1995–2003. NAFO SCR Doc., 04/09, Serial No. N4954, 22 p.
GONZÁLEZ-TRONCOSO, D., X. PAZ and X. CARDOSO. 2006. Persistence and Variation in the Distribution of Bottom-trawl Fish Assemblages over the Flemish Cap. J. Northw. Atl. Fish. Sci., 37: 103–117. http://dx.doi.org/10.2960/J.v37.m550
GONZÁLEZ-TRONCOSO, D., M. SACAU and F. GONZÁLEZ-COSTAS. 2007. A study of Spanish Greenland Halibut commercial effort and CPUE in 3LMNO using GIS with comparisons to the Spanish Division 3NO survey and EU Flemish Cap survey catches. NAFO SCR Doc., No. 54, Serial No. N5406. 12 p.
GORDON, J. D. H., N. R. MERRET and R. HEADRICH. 1994. Environmental and biological aspects of slopedwelling fishes of the North Atlantic. In: Deep Water Fisheries of the North Atlantic Oceanic slope, A. G. Hopper (ed). Proceedings of the NATO Advanced Research Workshop, March 1994, Kluwer, Dortdrecht, The Netherlands.
HACKER, S. D. and S. D. GAINES. 1990. Some implications of direct positive interactions for community species diversity. Ecology., 78(7), 1999–2003.
HAMILTON, L. C. and HAEDRICH, R. L. 1999. Ecological and population changes in fishing communities 1999: Polar Research. 18(2): 383–388. http://dx.doi.org/10.1111/j.1751-8369.1999.tb00318.x
HAEDRICH, R. L. 1994. Structure over time of an exploited deep water fish assemblage. In: Deep Water Fisheries of the North Atlantic Oceanic slope, A. G. Hopper (ed.). Proceedings of the NATO Advanced Research Workshop, March 1994, Kluver, Dortdrecht, The Netherlands.
HAEDRICH, R. L. and S. M. BARNES.1997. Changes over time of the size structure in an exploited shelf fish community. Aug 1997. Fisheries Research, Vol 31, Issue 3, p. 229–239. http://dx.doi.org/10.1016/S0165-7836(97)00023-4
HEINCKE, F. 1913. Untersuchungen über die Scholle-Generalbericht I. Schollenfischerei und Schonmassregeln. Vorlaeufige kurze Uebersicht über die wichtigsten Ergebnisse des Berichts. Rapport et Procès-verbaux des Réunions du ICES, 16, 1–70.
HUSTON, M. A. 1979. A general hypothesis of species diversity. American Naturalist, 113: 81–101. http://dx.doi.org/10.1086/283366
HUTCHINGS, J. A. and R. A. MYERS. 1994. What Can Be Learned from the Collapse of a Renewable Resource? Atlantic Cod, Gadus morhua, of Newfoundland and Labrador. Can. J. Fish. Aquat. Sci., 1994, 51 (9): 2126–2146. http://dx.doi.org/10.1139/f94-214
HUTCHINGS, J. A. and R. A. MYERS. 1995. The biological collapse of Atlantic cod off Newfoundland and Labrador: an exploration of historical changes in exploitation, harvesting technology, and management. In: The North Atlantic fisheries: successes, failures, and challenges. Edited by R. Arnason and L. Felt. Institute of Island Studies, University of Prince Edward Island, Charlottetown, P.E.I. p. 37–93.
HUTCHINGS J. A., 2000. Collapse and recovery of marine fishes. Nature, Vol. 406, 24 August 2000. www.nature.com
HUTCHINGS, J. A. and J. D. REYNOLDS. 2004. Marine fish population collapses: consequences for recovery and extinction risk. BioScience, 54: 297–309 http://dx.doi.org/10.1641/0006-3568(2004)054[0297:MFPCCF]2.0.CO;2.
IGLESIAS, S., X. PAZ and E. DE CARDENAS. 1996. Occurrence of American plaice (Hippoglossoides platessoides) at non-habitual depths in the northwest Atlantic, 1990–93. NAFO. Sci. Coun. Studies, 24: 91–95.
JENNINGS, S. and M. J. KAISER, 1998. The effects of fishing on marine ecosystems. Adv. Mar. Biol., 34: 203–352. http://dx.doi.org/10.1016/S0065-2881(08)60212-6 JOLLIFFE, I. T. 1986. Principal components analysis. Springer-Verlag. New York. http://dx.doi.org/10.1016/S0065-2881(08)60212-6
Jolliffe, I. T. 1986. Principal components analysis. Springer-Verlag. New York http://dx.doi.org/10.1007/978-1-4757-1904-8
KELLER A. A., J. R.WALLACE, B. H. HORNESS, O. S. HAMEL and I. J. STEWART. 2012. Variations in Eastern North Pacific demersal fish biomass based on the U.S. west coast groundfish bottom trawl survey (2003–2010). Fish. Bull., 110: 205–222.
KENDRICK, T. H. and M. P. FRANCIS. 2002. Fish assemblages in the Hauraki Gulf, New Zealand. N.Z. J. Mar. Freshwat. Res., 36: 699–717. http://dx.doi.org/10.1080/00288330.2002.9517124
KENNETH S., J. KANE and J. O’REILLY. 2004. Climate, ocean regimes and biomass yields of five North Atlantic large marine ecosystems. ICES CM 2004/M:05.
KOSLOW, J. A., 1993. Community structure in North Atlantic Deep-Sea Fishes. Prog. Oceanog., 31: 321–338. http://dx.doi.org/10.1016/0079-6611(93)90005-X
LABRAPOULOU, M. and C. PAPACONSTANTINOU. 2004. Community structure and diversity of demersal fish assemblages: the role of fishery. Sci. Mar. 68 (Suppl. 1): 215-226.
LEKVE, K., N. C. STENSETH, J. GJØSAETER, J. M. FROMENTIN and J. S. GRAY, 1999. Spatio-temporal patterns in diversity of a fish assemblage along the Norwegian Skagerrak coast. Mar. Ecol. Prog. Ser., 178: 17–27. http://dx.doi.org/10.3354/meps178017
LORENZO, M. I., J. M. D. ASTARLOA, W. NORBIS and M. B. COUSSEAU, 2011. Long term fish assemblages as units of management in a temperate estuary (Rio de la Plata - SW Atlantic Ocean). Brazilian Journal of Oceanography, 59 (1): 45–59.
MACPHERSON, E. and C. M. DUARTE. 1991 Bathymetric trends in demersal fish size: is there a general relationship? Mar. Ecol. Prog. Ser., 71 (2): 103–112 (1991). http://dx.doi.org/10.3354/meps071103
MAHON, R. and R.W. SMITH, 1989. Demersal fish assemblages on the Scotian Shelf, Northwest Atlantic: spatial distribution and persistence. Can. J. Fish. Aquat. Sci., 46 (Suppl. 1): 134–152. http://dx.doi.org/10.1139/f89-285
MAHON, R., S. K. BROWN, K. C. T. ZWANENBURG, D. B. ATKINSON, K. R. BUJA, L. CLAFLIN, G. D. HOWELL, M. E. MONACO, R. O’BOYLE and M. SINCLAIR. 1998. Assemblages and biogeography of demersal fishes of the east coast of North America. Can. J. Fish. Aquat. Sci., 55: 1704–1738. http://dx.doi.org/10.1139/f98-065
MAGNUSSEN, E. 2002. Demersal fish assemblages of Faroe Bank: species composition, distribution, biomass spectrum and diversity. Mar. Ecol. Prog. Ser., 238: 211–225. http://dx.doi.org/10.3354/meps238211
MARTIN, C. 1995. The collapse of the northern cod stocks: whatever happened to 86/25? Fisheries, 20 (5): 6–8.
MENEZES, G. M., H. M. SIGLER, M. R. SILVA and M. F. PINHO. 2006. Structure and zonation of demersal fish assemblages off the Azores Archipelago (mid-Atlantic). Mar. Ecol. Prog. Ser., 324: 241–260. http://dx.doi.org/10.3354/meps324241
MERRETT, N. R., R. L. HAEDRICH, J. D. M. GORDON and M. STEHMAN. 1991B. Deep demersal fish assemblage structure in the Porcupine Seabight (Eastern North Atlantic): Results of single warp trawling at lower slope to abyssal soundings. J. Mar. Biol. Assoc. UK, 71: 359–373. http://dx.doi.org/10.1017/S002531540005164X
MORANTA, J., C. STEFANESCU, E. MASSUTÍ, B. MORALES-NIN and D. LLORIS, 1998. Fish community structure and depth-related and depth-related trends on the continental slope of the Balearic Islands (Algerian basin, western Mediterranean). Mar. Ecol. Prog. Ser., 172: 247–259. http://dx.doi.org/10.3354/meps171247
MURUA, H. and E. D. E. CARDENAS. 2005. Depth-distribution of Deepwater Species in Flemish Pass. J. Northw. Atl. Fish. Sci., 37: 1–12. http://dx.doi.org/10.2960/J.v37.m563
OVERHOLTZ, W. J. and A. V. TYLER. 1985. Long-term responses of the demersal fish assemblages of Georges Bank. Fish. Bull., 83: 507–520.
PATROCINIO T. and X. PAZ. 2011. Discards and bycatch in Spanish fleet targeting Greenland halibut (Reinhardtius hippoglossoides) in NAFO. Divisions 3LMNO: 2008 and 2009. NAFO SCR Doc. 11/8. Serial No. N5888.
PAULY, D., V. CHRISTENSEN, S. GUÉNETTE, T. J. PITCHER, U. RASHID SUMAILA, C. J. WALTERS, R. WATSON and D. ZELLER. 2002. Toward sustainability in world fisheries. Nature, 418: 689–695 (8 August 2002) http://dx.doi.org/10.1038/nature01017
PAZ, X. and J. M. CASAS. 1996. Zonation and Associations of Dominant Fish Fauna on Flemish Cap. NAFO Sci. Coun. Studies, 25: 67–75.
PAZ X., D. GONZÁLEZ-TRONCOSO and P. DURÁN. 2002 Comparative Exercise of Efficiency Between CV Playa de Menduíña and RV Vizconde de Eza in the NAFO Divisions 3NO in May 2001. NAFO SCR Doc. 02/5. Serial No. N4603.
PERRY, R. I. and S. J. SMITH. 1994. Identifying habitat associations of marine fishes using survey data: an application to the Northwest Atlantic. Can. J. Fish. Aquat. Sci., 51: 589–602. http://dx.doi.org/10.1139/f94-061
PINHORN, A. T. and R. G. HALLIDAY. 1990. Canadian versus international regulation of Northwest Atlantic Fisheries: Management practices, fishery yields, and resource trends, 1960–1986. N. Am. J. Fish. Manage., 10: 154–174. http://dx.doi.org/10.1577/1548-8675(1990)010<0154:CVIRON>2.3.CO;2
POLLONI, P., R. L. HAEDRICH, G. T. ROWE and C. H. CLIFFORD. 1979 The size depth relationship in deep ocean animals. Int. Rev. Ges. Hydrobiol., 64: 39–46. http://dx.doi.org/10.1002/iroh.19790640103
PRIEDE, I. G., J. A. GODBOLD, N. J. KING, M. A. COLLINS, D. M. BAILEY and J. D. M. GORDON. 2010. Deep-sea demersal fish species richness in the Porcupine Seabight, NE Atlantic Ocean: global and regional patterns. Marine Ecology, 31: 247–260. http://dx.doi.org/10.1111/j.1439-0485.2009.00330.x
R DEVELOPMENT CORE TEAM. 2011. R: A language and environment for statistical computing. R Foundation for Statistical Computing. Vienna, Austria. ISBN 3-900051-07-0, URL http://www.R-project.org/
ROSE G. A. 2003. Fisheries Resources and Science in Newfoundland and Labrador: An Independent Assessment. Royal Commission on Renewing and Strengthening Our Place in Canada. Royal Commission, St. John's, NL. 84 p. 2005. On distributional responses of North Atlantic fish to climate change. ICES J. Mar. Sci., 62: 1360–1374. http://dx.doi.org/10.1016/j.icesjms.2005.05.007
SHANNON, C. E. and W. WEAVER, 1963. The mathematical theory of communication. Univ. of Illinois Press, Urbana.
SINCLAIR, A. F. and S. A. MURAWSKI. 1997. Why have groundfish stocks declined in the northwest Atlantic? In: J. Boreman, B. Nakashima, H. Pauls, J. Wilson and R. Kendall .Northwest Atlantic groundfish: perspectives on a fishery collapse. American Fisheries Society, Bethesda, Md. p. 71–93 STATSOFT, INC, 1998. Statistica for Windows. Tulsa, OK. http://www.statsoft.com
>STEPHENSON, W. T. and D. BURGES. 1980. Skewness of data in the analysis of species-in-sites-in-times. Proc. R. Soc. Queensland, 91: 37–52.
SNELGROVE, P. V. R. and R. L. HAEDRICH. 1985. Structure of the deep demersal fish fauna off Newfoundland. Mar. Ecol. Prog. Ser., 27: 99–107. http://dx.doi.org/10.3354/meps027099
STEFANESCU, C., R. RUCABADO and D. LLORIS. 1992. Depth–size trends in western Mediterranean demersal deep-sea fishes. Mar. Ecol. Prog. Ser., 81: 205–213. http://dx.doi.org/10.3354/meps081205
STEFANSDOTTIR, L., J. SOLMUNDSSON, G. MARTEINSDOTTIR, K. KRISTINSSON and J. P. JONASSON. 2010. Groundfish species diversity and assemblage structure in Icelandic waters during recent years of warming. Fisheries Oceanography. 19 (1): 42–62. http://dx.doi.org/10.1111/j.1365-2419.2009.00527.x
TER BRAAK, C. J. F. 1986. Canonical correspondence analysis: a new aigenvector method for multivariate direct gradient analysis. Ecology., 67: 1167–1179. http://dx.doi.org/10.2307/1938672
The R Project for Statistical Computing. http://www.r-project.org/
TOLIMIERI, N. and P. S. LEVIN. 2006. Assemblage structure of Eastern Pacific groundfishes on the U.S. continental slope in relation to physical and environmental variables. Trans. Am. Fish. Soc., 135: 317–332. http://dx.doi.org/10.1577/T05-092.1
VILLAGARCÍA, M. G. 1994. Structure and Distribution of Demersal Fish Assemblages on the Northeast Newfoundland and Labrador Shelf. M.Sc. Thesis, Department of Biology, Memorial University of Newfoundland, St. John's, Canada, 89 p
WENNER, C. A. and J. A. MUSICK, 1977. Biology of the morid fish Antimora rostrata in the western North Atlantic. J. Fish. Res. Bd. Can., 34: 2362–2368. http://dx.doi.org/10.1139/f77-316
WILLIAMS, A., J. A. KOSLOW and P. R. LAST. 2001. Diversity, density and community structure of the demersal fish fauna of the continental slope off western Australia (20 to 35° S). Mar. Ecol. Prog. Ser., 212: 247–263. http://dx.doi.org/10.3354/meps212247
WHITTAKER, R. H. and C. W. FAIRBANKS, 1958. A study of plankton copecod communities in the Columbia Basin, Southeastern Washington. Ecology, 39: 46–59. http://dx.doi.org/10.2307/1929966
WORM, B., R. HILBORN, J. K. BAUM, T. A. BRANCH, J. S. COLLIE, C. COSTELLO, M. J. FOGARTY, E. A. FULTON, J. A. HUTCHINGS, S. JENNINGS, O. P. JENSEN, H. K. LOTZE, P. M. MACE, T. R. MCCLANAHAN, C. MINTO, S. R. PALUMBI, A. M. PARMA, D. RICARD, A. A. ROSENBERG, R. WATSON and D. ZELLER. 2009. Rebuilding global fisheries. Science, 325 (5940): 578–585. http://dx.doi.org/10.1126/science.1173146.
ZINTZEN V., M. J. ANDERSON, C. D. ROBERTS, E. S. HARVEY and A. L. STEWART. 2012. Diversity and Composition of Demersal Fishes along a Depth Gradient Assessed by Baited Remote Underwater Stereo-Video. PLoS ONE 7 (10): e48522. http://dx.doi.org/10.1371/journal.pone.0048522
ZUUR, A. F., E. N. IENO and G. M SMITH, 2007. Analysing Ecological Data. Springer, New York, NY, USA.
1Partially funded by the European Union, under the Data Collection Framework, since 2005.
2There are three redfish species in the study area, S. fasciatus (Acadian redfish), S. mentella (deepwater redfish), and S. marinus (golden redfish). Due to the difficulty of visual identification of different species, the catches are usually reported by genus as Sebastes spp. In NAFO, the S. fasciatus and S. mentella are managed as an only species and S. marinus is not yet regulated.
|