Nancy L. Shackell
Kiyomi J. Ferguson
Cornelia E. den Heyer
Krista T. Ransier
Shackell, N.L.. K.J. Ferguson, C.E. den Heyer, D. Brickman, Z. Wang, and K.T. Ransier. 2019. Growing degree-day influences growth rate and length of maturity of Northwest Atlantic halibut (Hippoglossus hippoglussus L.) across the southern stock domain. J. Northw. Atl. Fish. Sci., 50: 25–35. https://doi.org/10.2960/J.v50.m716
Introduction
The definition of a stock unit is the foundation of a fish stock assessment, and often assumes that the unit captures uniform population dynamics (Cadrin et al., 2013; Kerr et al., 2016). Atlantic halibut (Hippoglossus hippoglussus L.) is a large, long-lived, cold-water, sexually dimorphic flatfish that can attain sizes up to 3 m in length, live up to 50 years, and ranges throughout the North Atlantic (Collette and Klein-Macphee, 2002). The management unit of NAFO Divisions 3NOPs4VWX5Zc Atlantic halibut extends about 20° of longitude (~2000 km) and 6° of latitude (~650 km), and includes three Northwest Atlantic Fishery Organization (NAFO) subareas, comprised of seven divisions and subdivisions (throughout this paper we will refer to both as ‘divisions’) (Fig. 1). This initial designation took place in 1988 and was based largely on the ecology of Pacific halibut (Hippoglossus stenolepis), which has been a focus of study by the International Pacific Halibut Commission (IPHC) since 1923. Over time, the Pacific halibut stock assessment has been refined as initial assumptions about, for example, constant growth and a highly migratory homogenous population, were overturned by new scientific evidence (Webster and Clark, 2013; Stewart and Martell, 2014; Nielsen and Seitz, 2017). On the Atlantic coast, halibut have received considerably less scientific attention, owing to the prioritization of the historically high value of Atlantic cod (em>Gadus morhua) and other groundfish species (Neilson et al., 1993). Atlantic halibut abundance and landings have been increasing steadily since the mid 2000s (Trzcinski and Bowen, 2016), resulting in a renewed interest, both commercial and scientific, in safe-guarding this valuable resource (den Heyer et al., 2013; Seitz et al., 2016; Shackell et al., 2016; Boudreau et al., 2017; Murphy et al., 2017; French et al., 2018; Le Bris et al., 2018). Recent tagging analyses (den Heyer et al., 2013; Seitz et al., 2016; Kersula and Seitz, 2019) as well as the spatial and temporal structure of juvenile distribution, suggests that halibut exhibit more resident non-migratory behavior than previously assumed (Shackell et al., 2016; Boudreau et al., 2017; French et al., 2018). It is timely to consider whether life history traits vary across the management unit and how results contribute to the management unit definition (Ying et al., 2011; McBride, 2014; Lorenzen, 2016). In this study, we investigate variation in individual growth rate and length at maturity of halibut across the stock domain.
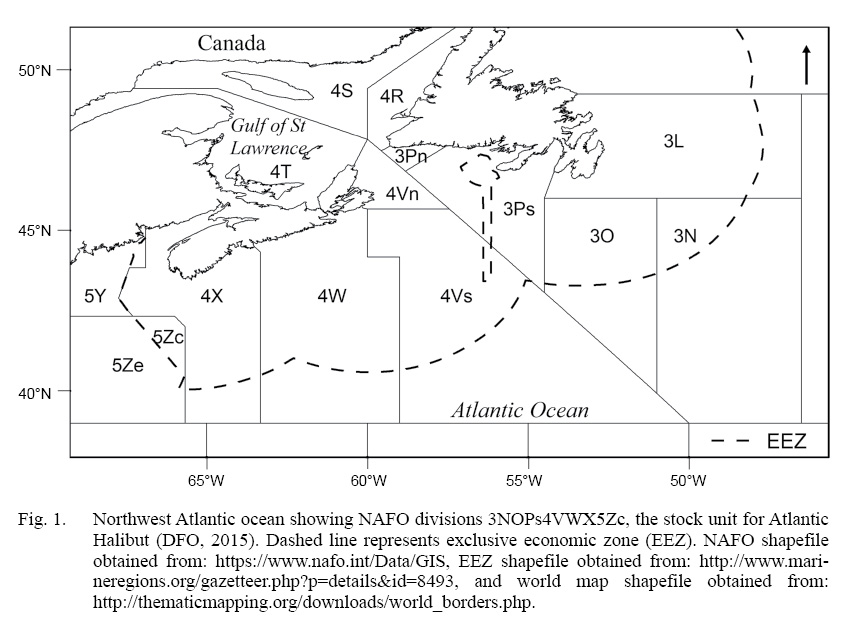
Fig. 1
As has been observed across several taxa (Cappo et al., 2013) including flatfish (Roff, 1982), individuals of the same species can grow more slowly and reach larger sizes at colder, higher latitudes than their smaller counterparts residing at warmer, lower latitudes. Sigourney et al. (2006) suggested that halibut may exhibit such a geographic gradient in length at maturity in the northwest Atlantic. The size at maturity for a population is often expressed as the value at which 50% of the sample is mature (LM50%). In the warmer southern divisions 4X5YZ (Fig. 1), Sigourney et al. (2006) estimated LM50% of male and female halibut to be 80 cm and 103 cm respectively. Whereas, in the colder northerly divisions two earlier studies estimated, male and female LM50% to be 77 cm and 119 cm (Trumble et al., 1993), and 80 cm and 125 cm respectively (Bowering, 1986). Average annual bottom temperature on the southern edge of the stock domain can be ~7°C warmer than on the northern edge. “Thermal time” (sensu ) Neuheimer and MacKenzie, 2014) is commonly referred to as growing degree-day (GDD) and is based on the concept that growth rate is dependent on temperature which affects physiological rates, and that the growth increment is dependent on the integral of suitable temperatures up to a given time or age (Neuheimer and Taggart, 2007). This concept of growth potential is borrowed from the agricultural field and has been used successfully to examine fish growth (e.g. Neuheimer and Taggart, 2007; Neuheimer et al., 2008; Neuheimer and Gronkjaer, 2012). Here we estimate growth rate and LM50% using two separate datasets linked to the stock-wide DFO-Industry halibut survey, and test the hypothesis that spatial variation is correlated with GDD. To compare with older studies and investigate whether life history traits vary among NAFO divisions, we predict growth and LM50% for each division using the median GDD per NAFO division.
Methods
Data
Joint Industry-DFO Halibut Longline Survey
The data used to estimate growth and maturity were obtained from two different programs conducted during the joint Industry-DFO Halibut Longline Survey. The Longline Survey is a fixed station survey that occurs mainly from May to August in NAFO divisions 3NOPs4VWX at locations with high historical halibut catch rates (Zwanenburg and Wilson, 1999). Between 1998 and 2016, roughly 220 fixed stations were sampled per year. Data were collected by DFO-certified fisheries observers on commercial fishing boats which used a standardized fishing protocol, comprised of 1000 size 14–16 circle hooks, and 6-12 hour soak times. All survey participants are required to fish within license conditions, including the mandatory discarding of all halibut less than the minimum legal length of 81 cm. Special license conditions were issued to some boats in 2011 to allow undersized fish to be retained for biological sampling as it is only possible to assess sex and maturity from gonads. Maturity data, referred to herein as the Maturity Collection (MC) Program, were collected by the fisheries observers on the Longline Survey trips. Growth data were derived from the Halibut All Sizes Tagging (HAST) Program (den Heyer et al., 2012), which uses the Longline Survey as its platform for tag release.
Halibut All Sizes Tagging (HAST) Program
We derived growth data using data from the HAST Program in which halibut were double-tagged using t-bar anchor tags (den Heyer et al., 2013). Data recorded by observers on the Longline Survey included release date, release length, and location. Sex, length, recapture date, recapture length, and location were reported at recapture. Recaptures were reported year round, with peak recaptures in the summer reflecting the seasonal distribution of fishing effort.
Maturity Collection (MC) Program
We derived maturity data from the MC program observer data collected on the Longline Survey. On the survey, DFO-certified fisheries observers recorded: location, depth, temperature, total catch, species by weight, individual weight, length, sex, and maturation state for all halibut caught on fixed station and commercial index sets. Maturity codes are assigned to each fish using a classification scheme that was updated in 2011 for the MC program, aimed to improve observers skills. In this study we only used data collected after 2010. Halibut maturity code definitions used by trained observers in the DFO-industry longline survey and commercial index are available upon request (C. den Heyer, pers.comm). Additionally, as a means to reducing uncertainty/inconsistencies that can be associated with the subjectivity of observer data, we conducted a further quality control analysis, and removed observers who showed signs of misclassification. Finally, we only included observers that had sampled in both NAFO divisions 3 and 4.
Growing degree-day (GDD) as an index of growing potential
GDD is the number of days multiplied by a daily temperature above a threshold, on an annual basis (units are denoted as °C*day). GDD were calculated using output from the high resolution numerical ocean circulation model “BNAM” (BIO North Atlantic Model). This model has been used to study a number of physical and ecosystem related processes in the Northwest Atlantic Ocean (Brickman et al., 2016, 2018; Wang et al., 2016). The model simulation starts in 1990 and runs to the present year. The 2001–2015 timeframe was used in this study. Spatial GDD was computed for each year as the time integral of bottom temperature greater than 3°C over the 12 month period (Fig. S2). The lower threshold of 3°C was chosen as halibut occur more frequently above 3°C (Shackell et al., 2016; French et al., 2018). Within the HAST dataset, we estimated the average GDD value for each tagged fish by connecting the release and recapture locations using a vector, drawing a 0.25 decimal degree buffer around the vector and then calculating the average GDD value within the buffer. Within the MC dataset, we estimated the average GDD values for each fish within 0.25 decimal degree buffers that were drawn around each sample point.
Analysis
Model Approach
We wished to determine the effect of GDD and fish length on growth rate, and on length at maturity, for each sex across NAFO divisions. We are interested in comparing life history trait estimates among NAFO divisions, to test the hypothesis that variation in GDD leads to variation in life history traits among NAFO divisions. Although the overlap is substantial, GDD varies among NAFO divisions with GDD in the northerly NAFO division 3N being lower than that in 4X (Fig. 2). To compare growth rate among NAFO divisions, we predicted growth rate at the median GDD per NAFO division. Because of the hierarchical structure in the MC data, we compared LM50% among NAFO divisions by resampling the MC data, and then aggregated predicted values by NAFO division. Differences among predicted values were evaluated with t-tests.
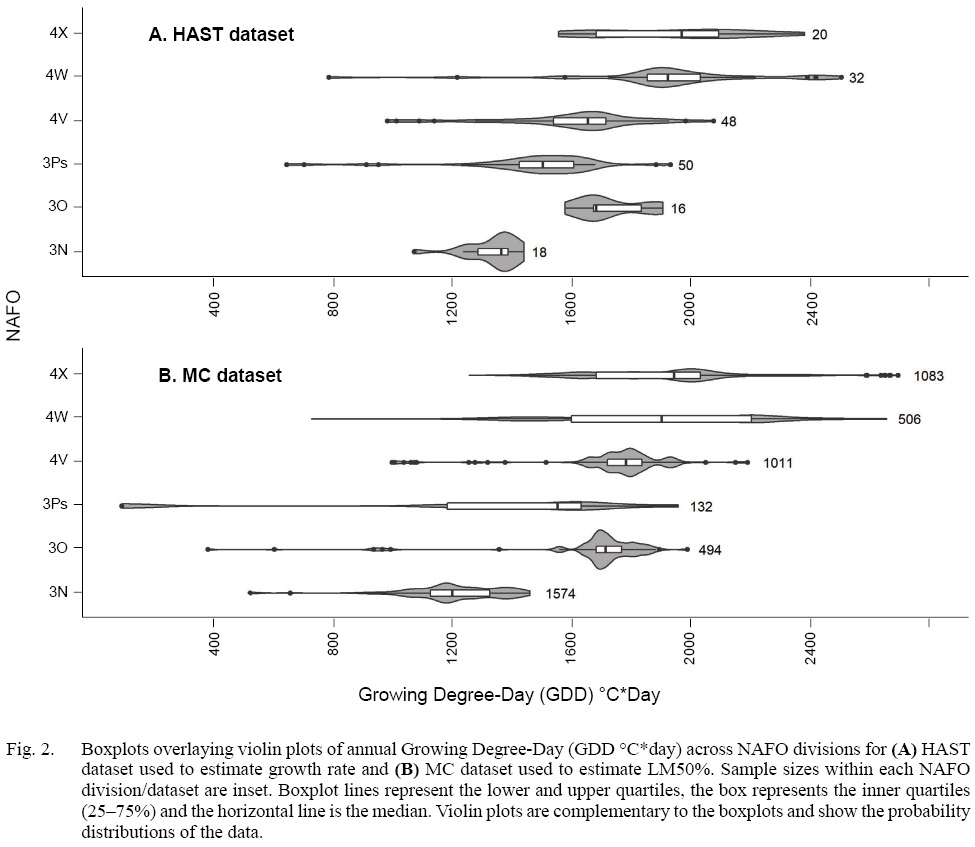
Fig. 2
Growth Model
Our goal was to predict growth rate using GDD and fish length for each sex. Using the HAST data, we selected all fish that were re-captured in the same NAFO division where they were initially tagged and at liberty for >60 days. We assumed growth followed a von Bertalanffy function, and used the Gulland and Holt (1959) method where relative growth is a function of average length at recapture and length at release.
 (1)
(1)
We used R statistical programming (R Core Team, 2018) to model Equation 1 (where GR is the length at recapture less the length at release per year for each sample, “a” is the intercept term, “b” is the coefficient corresponding to the effect of factor Sex, “c” is the coefficient specifying the effect of the covariate Length. Length is the average of length at release and length at recapture and “d” is the coefficient describing the effect of the covariate GDD. Our initial suite of models included an interaction term between the factor sex and the covariate length, to test whether the slope of growth rate on length differed between sexes. We assumed a Gamma distribution, and used generalized linear models specifying a log link. Models were evaluated based on Akaike’s Information Criterion (AIC), the model with significantly lower AIC was selected as the final model.
Maturity Model
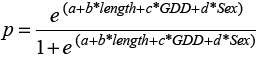
Our goal was to predict LM50% using GDD and length for each sex. Using the MC data, we used a generalized linear mixed model approach (Bates et al., 2015). We set observers (n = 8) as a random effect to address the variation in maturity assessment by observers. We used a logistic function to estimate LM50% (Equation 2).
 (2)
(2)
The response “p” is the proportion mature, “a” is the intercept, “b” is the coefficient describing relationship between length and the proportion “p” of mature fish, “c” is the coefficient describing relationship between GDD and “p”, and “d” is the coefficient describing the difference between the two sexes. We fit sequential models of increasing complexity, using a binomial error distribution. Models were evaluated based on Akaike’s Information Criterion (AIC), the model with significantly lower AIC was selected as the final model.
We simulated fixed and random effect parameter coefficients (n = 1000) using the final model posterior distributions to create Bayes estimates of the median and confidence intervals using the R package “merTools” (Knowles and Frederick, 2016). Predicted values and intervals were also simulated (n = 1000) from the model parameter distributions, from which we estimate length at 50% maturity (LM50%) and length ranges for each sex. The prediction intervals included residual variance of the model as well as fixed and random sources of uncertainty using a method recently developed by Knowles and Frederick (2016). The addition of residual variance greatly inflates the confidence intervals, and is rarely reported (Knowles and Frederick, 2016). However, we judged that it was important in this circumstance given the dynamic nature of observer derived data. Length ranges around the median LM50% were estimated as the length range where prediction intervals, around LM50%, corresponded to 50% mature.
Results
Growth (HAST) dataset summary
There were 97 females and 87 males, totaling 184 samples in the HAST dataset. Female average length ranged from 75.5 cm to 181.5 cm and a median length of 120 cm. The median GDD was 1623°C*day. Male average length ranged from 68.5 cm to 150.5 cm and the median length was 94 cm. The median GDD was 1671°C*day (Table S1, Fig. S1). Growth rate declined with length and increased with GDD in both sexes but there is considerable variation in all relationships (Fig. 3).
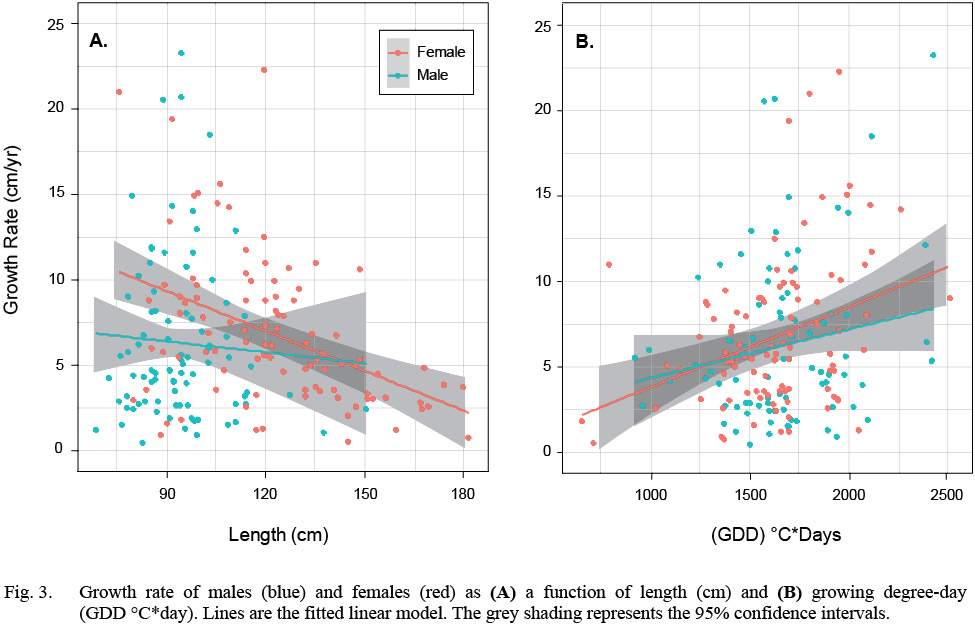
Fig. 3
Growth Rate Model
We first fit a model that included an interaction term between the factor sex and the covariate length, but the interaction term was not significant. Once the interaction was dropped from the model, all remaining terms were significant (Table 1). Annual growth rate declined with length, males grew more slowly than females and GDD had a significantly positive effect on both sexes. The model accounted for 19% of the variation in growth rate (McFadden’s pseudo-R2(Table 1).
Maturity (MC) dataset summary
There were 3082 females and 1718 males, totaling 4800 samples in the MC dataset; 47% of the females samples were mature while 62% of the male samples were mature. The minimum female length ranged from 60 cm to 178 cm and the median length was 95 cm. The median GDD was 1555°C*day. The minimum male length ranged from 68.5 cm to 150.5 cm and a median length of 94 cm. The median GDD was 1686°C*day (Table S1, Fig. S1).
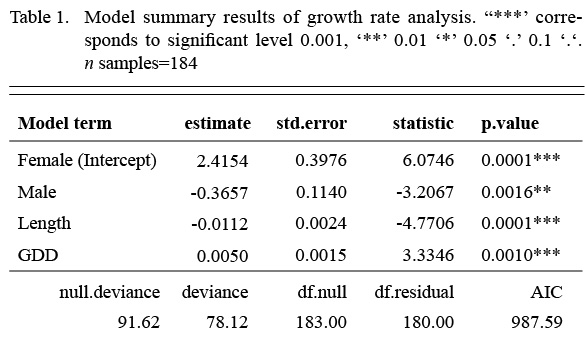
Table 1
Maturity Model
The model that best fit the data included a random intercept and a random slope for the observer effect (Table S2). The marginal (fixed effects alone) and conditional (fixed and random effects) R2 values were 0.46 and 0.75 respectively (n = 4800). Sex, length, and GDD had significant effects on maturity status (Table 2). Males were more likely to be mature at a smaller length than females. The fixed effect coefficient of fish length was relatively larger and positive, indicating that the likelihood of being mature was greater for larger fish. To a lesser effect, the likelihood of being mature was greater for fish associated with higher GDD (warmer, longer). To summarize, the likelihood of a fish being mature, in this data set, was greater for males, and at larger lengths and higher GDDs (Table 2, Fig. 4). The associated simulated random effects coefficients show that the intercepts of 4 observers are similar, but that there are two observers that differ (estimate differs from 0). With respect to median effect of random slopes, there are four observers that differ from the others, resulting in significant (differing from 0) simulated slope estimates (Fig. 4). Accounting for residual variance and uncertainty in the random and fixed effects resulted in very wide prediction intervals in all divisions (Fig. 5) and reflects that the program that trains observers how to assign maturity codes needs substantial improvement.
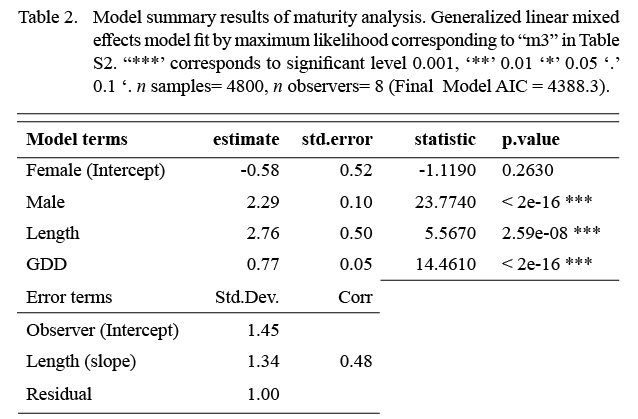
Table 2
Life history trait estimates among NAFO divisions
Both sexes grew faster in the more southerly divisions (4WX). With rates of up to 3.4 cm faster per year, the female growth rate corresponding to NAFO division 4X was significantly faster than in NAFO division 3N (Fig 6A, Table S3). Male growth rates corresponding to NAFO divisions 4X and 4W were significantly faster than those in NAFO divisions 3N and 3Ps, with rate up to 2 cm faster per year (Fig 6A, Table S3).

Fig. 4
Both sexes matured at smaller sizes in the more southerly divisions (4WX). However, there were no significant differences among regions within sex in LM50% due to such wide prediction intervals (Fig. 6B, Table S3). Across the stock domain, female LM50% ranged from 92–145 cm, and male LM50% range from 65–120 cm. The female LM50% median estimates in the warmer southern divisions 4X and 4W were ~10–28 cm less than the more northerly divisions. The male LM50% estimate in subdivision 4X was up to 9 cm less than in northerly subdivisions (Table S3).
Discussion
Female halibut grew faster and matured at larger sizes than males reflecting the sexual dimorphism of the species (Kohler, 1967; Collette and Klein-Macphee, 2002; Sigourneyet al., 2006; Armsworthy and Campana, 2010; Beaty and Chen, 2017). Growth rate declined with length and increased with growing degree-day (GDD). Growth rates of both males and females were greater in the southern divisions (4X/4W) than in the northern divisions (3N/3Ps). Length at maturity (LM50%) was smaller for both sexes in the southern divisions than in the northern divisions but the distributions overlap considerably, partially reflecting the variation among observers in maturity status classification.
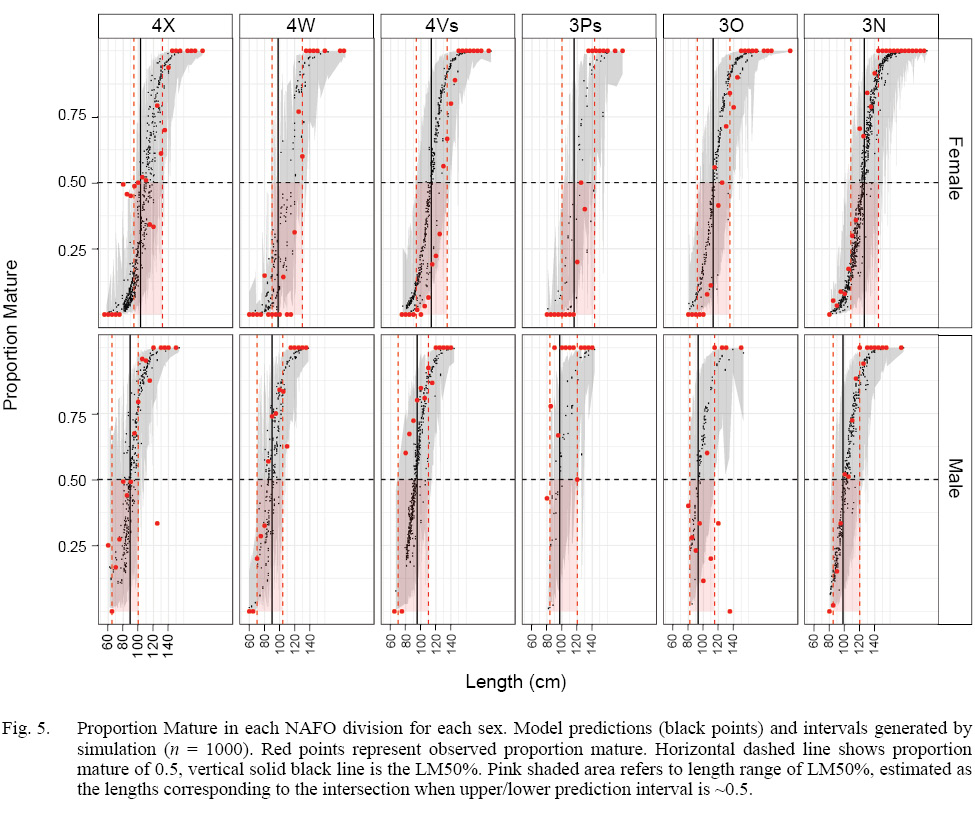
Fig. 5
Studies that have estimated halibut length at maturity in this region were published a long time ago, and often without confidence intervals. Despite that, older studies can help shape expectations. Female LM50% estimates in this study are consistent with other studies throughout the stock domain (Bowering 1986, Trumble et al., 1993; Sigourney et al., 2006). Sigourney et al. (2006) estimated female LM50% at 103 cm (CI 94–112 cm) in NAFO divisions 4X5YZ which is comparable to this study for female LM50% at 103 cm in 4X (CI 94–132 cm) and 98 cm in 4W (CI 90–130 cm). In an area corresponding to NAFO subarea 3, female LM50% was estimated as 119 cm (Trumble et al., 1993) and 125 cm (Bowering, 1986), which corresponds to the larger female LM50% range estimated in this study (113–126 cm). Still, the variation observed in this study precludes us producing definitive LM50% estimate per division. We can state that, on average, fish mature at a smaller size in 4WX, but we cannot predict length at maturity for any new observations in any division. Given the large variation in the observer random effect, a much larger sampling program with many more trained observers would be needed to improve maturity estimates from at-sea evaluations of gonads. Directed sampling that spans the size composition in each NAFO division for histological examinations, would provide improved estimates of size at maturity that would be more directly comparable to the historical data and allow for biologically important variation to be incorporated in stock assessment and management.
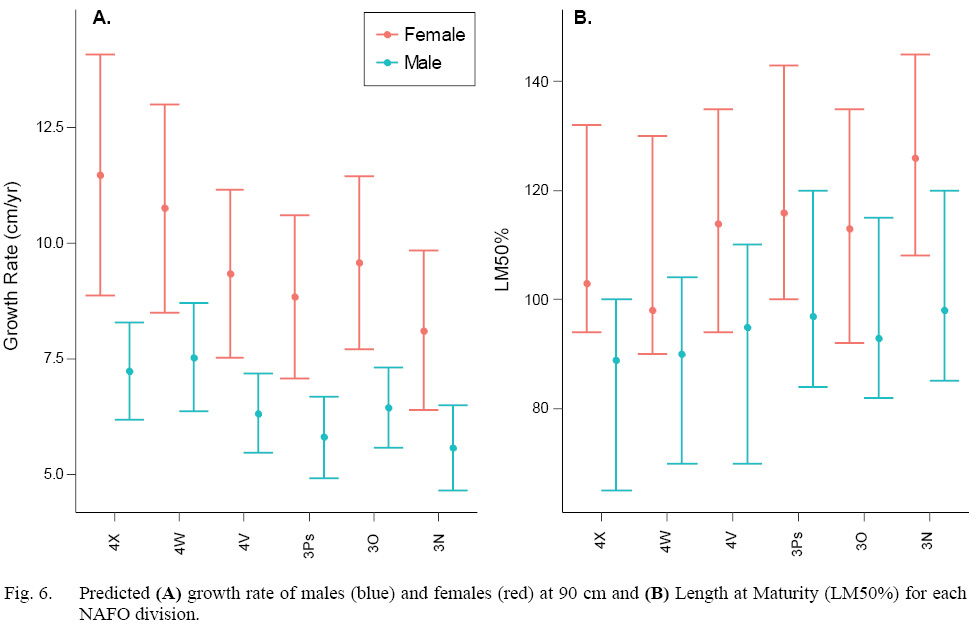
Fig. 6
A unit stock assumes uniform population dynamics which in turn are affected by: age/size structure, spawning stock biomass (SSB), recruitment rates, reproductive potential, intrinsic population growth rate, and carrying capacity. Significant geographic variation within a unit stock in demographic rates will not only affect the stock assessment, but can also contribute to spatial variation in fishing mortality and the disappearance of high density areas (McBride 2014, Carson et al., 2017). The current length-based, age-structured halibut assessment model (Cox et al., 2016) includes a sex-specific growth curve based on otolith aging (Armsworthy and Campana, 2010). Spatial variability in the age-selectivity between the Scotian Shelf (4VWX) and the southern Grand Banks (3NOPs) is reflected by the ample variation in the length composition in the catches. Armsworthy and Campana (2010) acknowledged that the variance of both subarea growth curves were large and overlapped considerably, but at that time, their results represented the best available evidence and so the spatial variability in growth was not included in the assessment model. Here, we provide new information on spatial variation of life history traits.
Many stock assessments assume fixed growth and maturity rates, whereas, in reality, growth rates can vary, within and among years (Lorenzen, 2016). Indeed, variation introduced by observers was evident but we cannot discount the hypothesis that growth rates and length at maturity are naturally highly variable due to phenotypic plasticity. Increasingly, the plasticity of growth has motivated researchers to include “time-varying” productivity components in stock assessment models but again, the monitoring of these dynamic traits is costly and unavailable to us at this time. In the absence of a sound understanding of the spatial and temporal dynamics of life history traits, to safeguard the stock, additional precautionary strategies such as the protection of juvenile nurseries, should be employed (Lorenzen, 2016; Nielsen and Seitz, 2017; Kersula and Seitz, 2019). For now, our results represent the best available evidence and will be considered in the next halibut stock assessment.
Recently, we provided evidence to support the notion that the current stock unit definition is masking smaller-scale dynamics (Shackell et al., 2016). This was further corroborated by other researchers who provided evidence that halibut in the eastern Gulf of Maine may be distinct from halibut in Canada (Seitz et al., 2016; Kersula and Seitz, 2019) although there is mixing (Kanwit, 2007; Shackell et al., 2016; Kersula and Seitz, 2019). We then identified persistent high density areas and estimated the connectivity among them to be an order of magnitude smaller than the current stock unit domain (Boudreau et al., 2017). Finally, we showed that the proportion of juvenile suitable habitat in each NAFO division is strongly related to historical (McCracken 1958) and current adult catch rates, supporting the “nursery size” hypothesis, which states that the amount of juvenile habitat is a proxy for adult production (French et al., 2018). Here, we demonstrated statistical differences in growth rate between the most southerly and the most northerly divisions, but, despite the significant influence of GDD on size at maturity, there were no statistically significant differences in LM50% estimates for the NAFO divisions. Our current assessment framework can be improved by incorporating the current and historical evidence for spatial variation and plasticity in life history traits.
At present the indices of abundance and landings for this stock are increasing or near all-time recorded highs (Cox et al., 2016; Trzcinski and Bowen, 2016; DFO, 2017). With the increase in abundance, we may see changes in life history traits such as growth and size at maturity that would impact the assessment. Monitoring programs will have to be designed to address spatial variability highlighted here. Further, the spatial variation in life history traits, highlighted herein and in Armsworthy and Campana (2010), may be linked to population structure. As the fishery expands, the failure to account for spatial structure could undermine the sustainability of the fishery and cost industry foregone yield. Careful review of all evidence, including genetics, life history variation and fisheries data is needed to evaluate the structure of this stock and ensure that management of the rapidly increasing commercial fishery is sustainable.
Acknowledgements
We are indebted to two anonymous reviewers and Brendan Wringe whose thorough critiques greatly improved the manuscript.
References
Armsworthy, S. L., and Campana, S. E. 2010. Age determination, bomb-radiocarbon validation and growth of Atlantic halibut (Hippoglossus hippoglossus) from the Northwest Atlantic. Environmental Biology of Fishes, 89: 279–295. http://link.springer.com/10.1007/s10641-010-9696-8.
Bates, D., Mächler, M., Bolker, B., and Walker, S. 2015. Fitting Linear Mixed-Effects Models Using lme4. Journal of Statistical Software, 67: 1–48. http://www.jstatsoft.org/v67/i01/.
Beaty, J., and Chen, Y. 2017. Can back-calculated lengths based on otoliths measurements provide reliable estimates of Atlantic halibut (Hippoglossus hippoglossus) growth in the Gulf of Maine (USA)? Aquacult. Fish., 2: 24–33. https://doi.org/10.1016/j.aaf.2017.01.002.
Boudreau, S. A., Shackell, N. L., Carson, S., and den Heyer, C. E. 2017. Connectivity, persistence, and loss of high abundance areas of a recovering marine fish population in the Northwest Atlantic Ocean. Ecology and Evolution, 7. https://doi.org/10.1002/ece3.3495.
Bowering, W. R. 1986. The distribution, age and growth and sexual maturity of Atlantic halibut (Hippoglossus hippoglossus) in the Newfoundland and Labrador area of the Northwest Atlantic. In: Canadian Technical Report of Fisheries and Aquatic Sciences, p. iv + 34 p. https://doi.org/10.1016/0165-7836(86)90039-1.
Brickman, D., Wang, Z., and DeTracey, B. 2016. Variability of current streams in Atlantic Canadian Waters: A model study. Atmos. Ocean., 54: 218–229. cchttps://doi.org/10.1080/07055900.2015.1094026.
Brickman, D., Hebert, D., and Wang, Z. 2018. Mechanism for the recent ocean warming events on the Scotian Shelf of eastern Canada. Continental Shelf Research, 156: 11–22. https://doi.org/10.1016/j.csr.2018.01.001.
Cadrin, S., Kerr, L. A., and Mariani, S. 2013. Stock identification methods: applications in fishery science. Academic Press.
Cappo, M., Marriott, R. J., and Newman, S. J. 2013. James’s rule and causes and consequences of a latitudinal cline in the demography of John’s Snapper (Lutjanus johnii) in coastal waters of Australia. Fishery Bulletin, 111: 309–324. https://doi.org/10.7755/fb.111.4.2.
Carson, S., Shackell, N and Mills-Flemming, J. 2017. Local overfishing may be avoided by monitoring parameters of a Spatio-temporal model. PloS one 12 (9), e0184427.
Collette, B. B., and Klein-Macphee, G. 2002. Atlantic halibut / Hippoglossus hippoglossus (Linneaus 1758). In: Bigelow and Schroeder’s Fishes of the Gulf of Maine:, p. 569–572. Blackburn Press.
Cox, S. P., Benson, A., and den Heyer, C.E., 2016. Framework for the Assessment of Atlantic Halibut Stocks on the Scotian Shelf and Southern Grand Banks. DFO Can. Sci. Advis. Sec. Res. Doc. 2016/001. v + 57 p.
den Heyer, C. E., Armsworthy, S., Wilson, S., Wilson, G., Bajona, L., Bond, S., and Trzcinski, M. K., 2012. Atlantic halibut all-sizes tagging Program summary report for 2006 to 2011. vii+34.
den Heyer, C. E., Schwarz, C. J., and Trzcinski, M. K., 2013. Fishing and natural mortality rates of Atlantic halibut estimated from multiyear tagging and life history. Transactions of the American Fisheries Society, 142: 690–702. https://doi.org/10.1080/00028487.2012.760482.
DFO. 2017. Stock status update of Atlantic halibut on the Scotian Shelf and southern Grand Banks (NAFO Divs. 3NOPs4VWX5Zc). DFO Can. Sci. Advis. Sec. Sci. Resp., 2017/021.
French, K., Shackell, N., and den Heyer, C. E., 2018. Strong relationship between commercial catch of adult Atlantic halibut (Hippoglossus hippoglossus) and suitable habitat availability of juveniles in the northwest Atlantic. Fishery Bulletin, 116: 107–125. https://doi.org/10.7755/fb.116.2.1.
Gulland, J. A. and Holt, S. J., 1959: Estimation of growth parameters for data at unequal time intervals. — J. Cons.CIEM. 25: 47–49.
Kerr, L. A., Hintzen, N. T., Cadrin, S. X., Clausen, L. W., Dickey-Collas, M., Goethel, D. R., Hatfield, E. M. C., et al., 2016. Lessons learned from practical approaches to reconcile mismatches between biological population structure and stock units of marine fish. ICES Journal of Marine Science: Journal du Conseil: fsw188. https://academic.oup.com/icesjms/article-lookup/doi/10.1093/icesjms/fsw188.
Kersula, M., and Seitz, A., 2019. Diverse migratory behaviors of Atlantic halibut (Hippoglossus hippoglossus, L.) based on the 2000–2017 Maine halibut tagging program. J. Northw. Atl. Fish. Sci., 50: 13–24. doi:10.2960/J.v50.m719.
Knowles, J. E., and Frederick, C. 2016. merTools: Tools for Analyzing Mixed Effect Regression Models. R package version 0.3.0.
Kohler, A. C. 1967. Size at Maturity, Spawning Season, and Food of Atlantic Halibut. Fisheries Research, 24: 53–66. https://doi.org/10.1139/f67-006.
Le Bris, A., Fisher, J. A. D., Murphy, H. M., Galbraith, P. S., Castonguay, M., Loher, T., and Robert, D. 2018. Migration patterns and putative spawning habitats of Atlantic halibut (Hippoglossus hippoglossus) in the Gulf of St. Lawrence revealed by geolocation of pop-up satellite archival tags. ICES Journal of Marine Science, 75: 135–147. https://doi.org/10.1093/icesjms/fsx098.
Lorenzen, K. 2016. Toward a new paradigm for growth modeling in fisheries stock assessments: Embracing plasticity and its consequences. Fisheries Research, 180: 4–22. Elsevier B.V. https://doi.org/10.1016/j.fishres.2016.01.006.
McBride, R. S. 2014. Managing a Marine Stock Portfolio: Stock Identification, Structure, and Management of 25 Fishery Species along the Atlantic Coast of the United States. North American Journal of Fisheries Management, 34: 710–734. https://doi.org/10.1080/02755947.2014.902408.
McCracken, F.D. 1958. On the biology and fishery of the Canadian Atlantic Halibut, Hippoglossus hippoglossus L. J. Fish. Res. Board Canada 15(6): 1269–1311. http://www.nrcresearchpress.com/doi/abs/10.1139/f58-070.
Murphy, H. M., Fisher, J. A. D., Le Bris, A., Desgagnés, M., Castonguay, M., Loher, T., and Robert, D. 2017. Characterization of Depth Distributions, Temperature Associations, and Seasonal Migrations of Atlantic Halibut in the Gulf of St. Lawrence using Pop-Up Satellite Archival Tags. Marine and Coastal Fisheries, 9: 341–356. Taylor & Francis. https://www.tandfonline.com/doi/full/10.1080/19425120.2017.1327905.
Neilson, D., Kearney, J. F., Perley, P., and Sampson, H. 1993. Reproductive Biology of Atlantic Hippoglossus hippoglossus) in Canadian Waters. Can. J. Fish. Aquat. Sci., 50: 551–563. https://doi.org/10.1139/f93-064.
Neuheimer, A. B., and Taggart, C. T. 2007. The growing degree-day and fish size-at-age: the overlooked metric. Can. J. Fish. Aquat. Sci., 64: 375–385. http://www.nrcresearchpress.com/doi/abs/10.1139/f07-003.
Neuheimer, A. B., Taggart, C. T., and Frank, K. T. 2008. Size-at-Age in Haddock (Melanogrammus aeglefinus): Application of the Growing Degree-Day (GDD) Metric. 111–124. https://doi.org/10.4027/rgsfcc.2008.06.
Neuheimer, A. B., and Gronkjaer, P. 2012. Climate effects on size-at-age: growth in warming waters compensates for earlier maturity in an exploited marine fish. Global Change Biology, 18: 1812–1822. https://doi.org/10.1111/j.1365-2486.2012.02673.x.
Neuheimer, A. B., and MacKenzie, B. R. 2014. Explaining life history variation in a changing climate across a species’ range. Ecology, 95: 3364–3375. https://doi.org/10.1890/13-2370.1.
Nielsen, J. K., and Seitz, A. C. 2017. Interannual site fidelity of Pacific halibut: potential utility of protected areas for management of a migratory demersal fish. ICES Journal of Marine Science, 74(8), 2120–2134. https://academic.oup.com/icesjms/article-lookup/doi/10.1093/icesjms/fsx040.
R Core Team. 2018. R: A language and environment for statistical computing. R Foundation for Statistical Computing, Vienna, Austria. https://www.r-project.org/.
Roff, D. A. 1982. Reproductive Strategies in Flatfish: A First Synthesis. Can. J. Fish. Aquat. Sci., 39: 1686–1698. https://doi.org/10.1139/f82-225.
Seitz, A. C., Evans, M. D., Courtney, M. B., and Kanwit, J. K. 2016. Continental shelf residency by adult Atlantic halibut electronic tagged in the Gulf of Maine. Journal of Northwest Atlantic Fishery Science, 48: 33–40. https://doi.org/10.2960/j.v48.m713.
Shackell, N. L., Frank, K. T., Nye, J. A., and Heyer, C. E. Den. 2016. A transboundary dilemma: dichotomous designations of Atlantic halibut status in the Northwest Atlantic. ICES Journal of Marine Science, 73, Issue 7, 1798–1805. https://doi.org/10.1093/icesjms/fsw042.
Sigourney, D. B., Ross, M. R., Brodziak, J., and Burnett, J. 2006. Length at Age, Sexual Maturity and Distribution of Atlantic Halibut, Hippoglossus hippoglossus L., off the Northeast USA. Journal of Northwest Atlantic Fishery Science, 36: 81–90. https://doi.org/10.2960/j.v36.m574.
Stewart, I. J., and Martell, S. J. D. 2014. A historical review of selectivity approaches and retrospective patterns in the Pacific halibut stock assessment. Fisheries Research, 158: 40–49. Elsevier B.V. https://doi.org/10.1016/j.fishres.2013.09.012.
Trumble, R. J., Neilson, J. D., and Bowering, W.R. McCaughran, D. A. 1993. Atlantic halibut (Hippoglossus hippoglossus) and Pacific halibut (H. stenolepis) and their North American fisheries. 84 p. https://doi.org/10.1080/10641269309388546.
Trzcinski, M. K., and Bowen, W. D. 2016. The recovery of Atlantic halibut: a large, long-lived, and exploited marine predator. ICES Journal of Marine Science, 73: 1104–1114. https://doi.org/10.1093/icesjms/fsv266.
Wang, Z., Brickman, D., Greenan, B. J. W., and Yashayaev, I. 2016. An abrupt shift in the Labrador Current System in relation to winter NAO events. Journal of Geophysical Research: Oceans, 121: 5338–5349. http://doi.wiley.com/10.1002/2016JC011721.
Webster, R., and Clark, W. 2013. Pacific halibut on the move: a renewed understanding of adult migration from a coastwide tagging study. Can. J. Fish. Aquat. Sci., 70: 642–653. https://doi.org/10.1139/cjfas-2012-0371.
Ying, Y., Chen, Y., Lin, L., and Gao, T. 2011. Risks of ignoring fish population spatial structure in fisheries management. Can. J. Fish. Aquat. Sci., 68: 2101–2120. http://www.nrcresearchpress.com/doi/abs/10.1139/f2011-116.
Zwanenburg, K. C. T., and Wilson, S. 1999. Halibut Survey on the Southern Grand Banks and Scotian Shelf. Participants Manual: 30p.
Shackell, N.L.. K.J. Ferguson, C.E. den Heyer, D. Brickman, Z. Wang, and K.T. Ransier. 2019. Growing degree-day influences growth rate and length of maturity of Northwest Atlantic halibut (Hippoglossus hippoglussus L.) across the southern stock domain. J. Northw. Atl. Fish. Sci., 50: 25–35. https://doi.org/10.2960/J.v50.m716