Introduction
Greenland halibut Reinhardtius hippoglossoides is a deepwater flatfish with a circumpolar distribution. It is an important commercial species in the Newfoundland and Labrador region with a fishery that is executed primarily on immature fish (NAFO, Scientific Council Report 2010). This species has many intriguing features that are atypical of flatfish, including a highly active and migratory lifestyle and reduced association with the substrate (de Groot, 1970; Bowering, 1984; Bowering and Lilly, 1992; Boje, 2002; Vollen and Albert, 2008; Dennard et al., 2009).
Aspects of Greenland halibut reproductive biology are equally intriguing. For example, early tagging data suggested that Greenland halibut around Newfoundland and Labrador migrated northward to the Davis Strait to spawn (Templeman, 1973) but as surveys and fisheries extended effort to depths exceeding 1000 m, it became apparent that some degree of spawning also occurs in areas along the Newfoundland and Labrador Shelf (Junquera and Zamarro, MS 1992). There have also been longstanding questions regarding the pattern of oocyte development in this species. Fish species examined to date have been categorized within one of three well-described patterns of oocyte development: synchronous, group synchronous, and asynchronous (Wallace and Selman, 1981; Tyler and Sumpter, 1996; Murua and Saborido-Rey, 2003). Synchronous species (e.g. Pacific salmons) exhibit the synchronous development of all oocytes within the ovary, leaving no ‘reserve’ oocytes for spawning in subsequent years. Group synchronous species (e.g. Atlantic cod Gadus morhua) contain a distinct mode of developing oocytes that will be spawned in the current year as well as a reserve of immature oocytes that will form the basis for spawning in subsequent years. Asynchronous species contain all potential oocyte stages and sizes at the same time with no obvious modes. They are characterized by continuous recruitment of oocytes into vitellogenesis. Greenland halibut ovaries are typical of a group synchronous species in that they contain both a mode of developing (i.e. vitellogenic) oocytes as well as immature oocytes. Unlike a typical group synchronous species, a second mode of oocytes begins to develop as development of the first mode proceeds, such that the ovaries contain two distinct modes of vitellogenic oocytes. The difficulty in categorizing the oocyte development pattern of Greenland halibut has come as a result of trying to fit this species into one of the current categories by speculating as to the fate of the second group of developing oocytes. Among the suggestions for this second group of developing oocytes were the idea that they were (1) residual (Junquera and Saborido-Rey, MS 1995) and eventually resorbed (Fedorov, 1968) or, (2) the basis for a second spawning episode later in the summer (Fedorov, 1968), or (3) quickly promoted through vitellogenesis in order to increase the current year’s reproductive output (Rideout et al., 1999). These suggestions were highly driven by the assumption that vitellogenesis in Greenland halibut was an annual phenomenon as seen in other well studied fish, like Atlantic cod. More recently it was suggested that Greenland halibut of the Northeast Arctic stock are characterized by the simultaneous development of oocytes for this year and next year (Kennedy et al., 2011). This strategy enables annual spawning despite the fact that vitellogenesis requires greater than one year to complete (Junquera et al., 2003) and was suggested to be a unique strategy among fishes described to date (Kennedy et al., 2011).
The physiological processes involved in controlling vitellogenesis in fishes with traditional oocyte development patterns (e.g. group synchronous) have been studied in detail (Wallace, 1985; Specker and Sullivan, 1994; Tyler et al., 2000). Basically, surges in pituitary and gonadal hormones stimulate the production of vitellogenin by hepatocytes. The vitellogenin enters the bloodstream, is actively sequestered by developing oocytes, and is cleaved to form yolk proteins. The accumulation of these yolk proteins results in a major period of oocyte growth, and upon fertilization provides the primary nutritional source for developing embryos and yolk-sac larvae. Most fishes have seasonal reproductive patterns and hence the production of vitellogenin occurs on a seasonal basis (e.g. Methven et al., 1992; Mosconi et al., 1998; Sun and Pankhurst, 2003; Mandich et al., 2004; Guzmán et al., 2008). The proposed pattern of reproductive development for Greenland halibut (i.e. the simultaneous development of vitellogenic oocytes for two consecutive years), however, suggests that mature fish will always possess vitellogenic oocytes. The pattern of vitellogenin production for such a strategy has never been demonstrated but could potentially be quite different than the previously demonstrated cycles for fish with only a seasonal occurrence of vitellogenic oocytes.
The objectives of the current study were to evaluate the unusual oocyte development strategy proposed for Greenland halibut based on fish from the Northwest Atlantic stock and to examine the annual vitellogenin production cycle in relation to fish with more typical oocyte development patterns. Analyses are based on samples collected from wild fish as well as the first reported reproductive work on Greenland halibut in captivity.
Material and Methods
Wild Fish: Sample collection and histology
A sample of ovarian tissue was taken from Greenland halibut (n = 301) collected during Canadian multi-species groundfish surveys and from commercial gillnets in 2006 and 2007 (Fig. 1, Table 1) and fixed in 10% neutral buffered formalin. Blood was collected from the caudal peduncle using a heparinized syringe and centrifuged at 1200 x g for one min. The supernatant was removed and frozen (-20°C at sea for up to two weeks, followed by -80°C in the lab) until analyzed for vitellogenin.
|
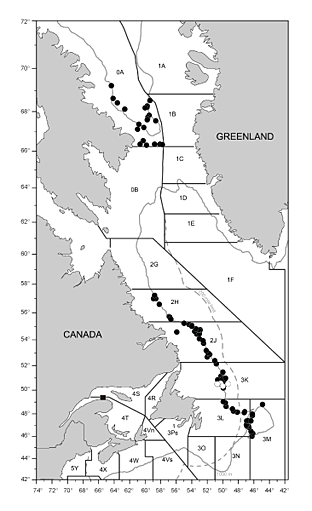
Fig. 1. Map of northwest Atlantic demonstrating areas where Greenland halibut were sampled by bottom trawl (solid circles) and deepwater gillnets (open circles) as well as the collection site for fish that were transferred to the laboratory for captive studies (solid square). Northwest Atlantic Fisheries Organization (NAFO) management divisions are demonstrated along with the Canadian 200 mile limit (dashed grey line) and the 1000 m depth contour (solid grey line).
|
Thin (~5 mm) cross-sections were removed from each of the formalin-fixed ovary samples, run through a dehydration series (Leica TP1020) and embedded in Paraffin (Leica EG1160). Sections were cut at 5–7 µm using an automated rotary microtome (Leica RM2265) and stained with Haematoxylin and Eosin (Leica Auto Stainer XL).
Histological maturity status was assigned based on the criteria of Federov (1968). This scale is based on the cytoplasmic characteristics of the oocytes present in the ovary (Table 2). Digital images of each ovary section were captured using a compound microscope (Leica DM 1000) equipped with a digital camera (Leica DFC490). Using the freeware ImageJ (http://rsb.info.nih.gov/ij/) and a drawing tablet (Wacom Cintiq® 21UX), the outline of individual oocytes was traced and the cross-sectional area calculated. Only those oocytes that were sectioned through the nucleus were included.
Oocyte diameter was calculated based on the formula for the area of a circle and the mean vitellogenic oocyte diameter (minimum of n = 15 oocytes) was calculated. In more advanced fish, a hiatus in oocyte size frequency distribution appeared at approximately 750–900 µm, which agrees with previous reports (e.g. Kennedy et al., 2011). In such cases the vitellogenic oocytes on each side of the hiatus were considered as distinct modes and we calculated the average diameter for each group. Vitellogenic modes to the right of the hiatus were referred to as the leading cohort (LC; equivalent to the G1 of Gundersen et al., 2010) and always had a mean diameter > 1000 µm. The mode of vitellogenic oocytes to the left of the hiatus (or when only a single mode was present, i.e. no hiatus) was referred to as the developing cohort (DC; equivalent to the G2 of Gundersen et al., 2010) and always had a mean diameter of < 950 µm. No distinction was made here between early vitellogenic and cortical alveoli stage oocytes (i.e. both were considered part of the DC). This approach is supported by the fact that there is no hiatus in size distribution between cortical alveoli and early stage vitellogenic oocytes (Kennedy et al., 2011).
Captive Fish: Husbandry, experimental design and sample collection
The work done here to monitor the growth and reproductive development of Greenland halibut in captivity would appear to be the first published report of its kind so some text dedicated to describing the methods used to collect and maintain Greenland halibut in captivity is provided prior to the details of the experimental design.
Greenland halibut used for the experiment were caught with longlines in the St. Lawrence Estuary in October 2005. Fishing activities were conducted at depths between 200 and 350 m in areas around Matane (48° 59' N, 67° 25' W) and Mont-Louis, Québec (49° 14' N, 65° 44' W). Soaking time was normally between 12 and 24 h. Live specimens lifted aboard were placed in 1 m³ tanks with aerated seawater at ~ 5°C. Individuals with wounds, broken jaws or that appeared thin and moribund were not kept. Live fish were brought ashore every day and placed in land based 1 m³ tanks with aerated seawater at densities not exceeding ~ 30–40 fish per m³. Within 12 to 48 h following capture, fish were transported via truck in tanks with aerated seawater to the Maurice Lamontagne Institute (Fisheries and Oceans Canada, Mont-Joli, QC) located at a distance of 100–350 km. Mortality during transport was very low (~1%). In the lab, fish were kept in two 24 m³ tanks (4 m x 4 m x 1.5 m depth) at temperatures between 3 and 5°C and salinities between 28 and 32 ppm under natural photoperiod. Fish resumed feeding after an acclimation period of 2 to 4 weeks. They were then fed to satiation with capelin Mallotus villosus, three times a week until the beginning of the experiment in June 2006.
The maturation experiment was conducted in 2 semi-squared (2m x 2m) tanks. Seawater flow to each tank was ~ 10–15 L.min–1 through a semi-recirculated system equipped with a head tank, a sand filter and a thermo pump to regulate water temperature. Seawater temperature was kept constant at 5°C under conditions of natural photoperiod (latitude 49°45’ N) and salinity (28–32 ppm) for the duration of the experiment.
At the beginning of the experiment, 30 fish were randomly distributed in the two experimental tanks. Fish were anaesthetized in a 5mg . L-1 metomidate solution (Mattson and Riple, 1989), measured (fork length ± 1mm), weighed (± 0.1g), and individually identified with a passive integrated transponder (PIT) tag injected in the muscle below the dorsal fin. Fish were fed to satiation three times weekly with capelin for the duration of the experiment. Feeding was stopped three days before each sampling period to ensure that fish had empty stomachs when manipulated.
The two groups of 15 fish were monitored on a two month interval in order to examine reproductive development in captivity. The first group of fish was examined in months 7, 9, 11, 1, 3, 5, 7 (where 1 is January), while the second group was examined in months 8, 10, 12, 2, 4, 6, 8. At each examination period, fish were anaesthetized, measured, weighed, and observations on maturity status were recorded. Maturity was estimated based on a combination of the fish’s external features and observations on gonad size and the presence/absence of hydrated oocytes using ultrasound (Table 3). During each examination period a blood sample was collected from the caudal peduncle and frozen for the determination of plasma vitellogenin concentration as described previously for samples from the wild fish. All fish were euthanized at the end of the study. Once killed, information was collected as per previous sampling dates along with ovary and liver weight. Reproductive status was determined by macroscopic examination of the gonads.
Identification and quantification of vitellogenin
Greenland halibut blood samples were analyzed by high performance liquid chromatography coupled to electrospray ionization tandem mass spectrometry (HPLC-ESI-MS/MS), according to Cohen et al. (2009). This technique for protein quantification was adopted due to the absence of commercial antibodies targeting vitellogenin for this particular species. Briefly, plasma samples were subjected to an overnight trypsin digestion and later analyzed by HPLC-ESI-MS/MS operated in Selective Reaction Monitoring (SRM) mode. The SRM method monitored two diagnostic MS/MS transitions (m/z 750.0→1020.4 and 750.0→1205.4) of a characteristic vitellogenin ‘signature’ peptide (sequence: FFGQEIAFANIDK). The concentrations of vitellogenin were calculated from calibration curves of this peptide obtained by chemical synthesis according to the following equation:
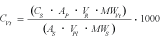
where>
AP = integrated area of peptide
AS = average integrated area of peptide standard
VR = final reaction volume in µl
VPl = plasma volume in µl
MWVt = molecular weight of Greenland halibut vitellogenin in g/mol or Da
MWS= molecular weight of the peptide standard in g/mol or Da
The concentration of peptide standard used here was CS = 1 µg/ml. The average integrated area of the 1 µg/ml peptide standard was AS = 14 427. The final reaction volume was VR = 110 µl. The volume of plasma used was VPls = 1 µl. The sequence of Greenland halibut vitellogenin is not known but the molecular weight has been estimated at 185 000 Da according to SDS-PAGE analysis (Cohen et al., 2009). The molecular weight of the peptide standard was 1499 Da.
Seasonal vitellogenin profiles were examined for individual fish in captivity and compared to vitellogenin data obtained from wild fish. For wild fish, data points that were one or more standard errors from the mean were considered outliers and were removed.
Results
Oocyte development strategy
Histological analyses (Fig. 2) confirmed that Greenland halibut ovaries in the early stages of development contained small vitellogenic and cortical alveoli stage oocytes. Later in development a hiatus in oocyte size frequency distribution appears, resulting in a mode of large (LC) and smaller (DC) vitellogenic oocytes (Fig. 2). Comparison of mean oocyte diameter between LC and DC oocytes within the same fish showed that DC oocytes are growing simultaneously with LC oocytes but at a much slower rate of development (Fig. 3).
|
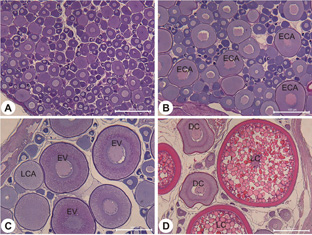 Fig. 2. Histological sections of Greenland halibut ovaries. (A) Immature ovaries contain primary stage oocytes. (B) Development begins with the formation of early cortical alveoli stage oocytes (ECA) followed by (C) the appearance of late stage cortical alveoli oocytes (LCA) and early vitellogenic oocytes (EV). (D) later in development two cohorts of vitellogenic oocytes are present, the leading cohort (LC) and the developing cohort (DC). Standard HandE stain. Scale bar = 500 µm. Fig. 2. Histological sections of Greenland halibut ovaries. (A) Immature ovaries contain primary stage oocytes. (B) Development begins with the formation of early cortical alveoli stage oocytes (ECA) followed by (C) the appearance of late stage cortical alveoli oocytes (LCA) and early vitellogenic oocytes (EV). (D) later in development two cohorts of vitellogenic oocytes are present, the leading cohort (LC) and the developing cohort (DC). Standard HandE stain. Scale bar = 500 µm.
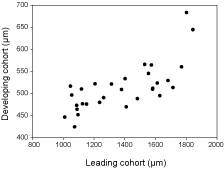
Fig. 3. Size of the most advanced group of developing Greenland halibut oocytes (i.e. leading cohort) in relation to the less advanced group of developing oocytes (i.e. developing cohort).
|
Growth and reproductive development in captivity
Four fish died during the study. Another eight fish demonstrated fin erosion and/or substantial negative growth in weight and were excluded from the analyses. Therefore data on growth and reproductive development were collected from a total of 18 females.
Growth in length ranged from 0.2 to 6.0 cm per year (Table 4). Growth was significantly reduced in fish that spawned in comparison to fish that did not spawn (t-test, p = 0.01).
Eight fish spawned successfully in captivity (Table 4, Fig. 4). Five of these were actually observed to have clear, running eggs during regular sampling or on the final sampling day when fish were killed. The other three were never observed in spawning condition but upon the final (lethal) sampling were observed to have spent ovaries containing residual hydrated oocytes. This was taken as evidence that the fish had recently spawned. Five of the fish that spawned also demonstrated a sharp decline in weight (Fig. 4), representing the weight loss from the release of oocytes during spawning.
|
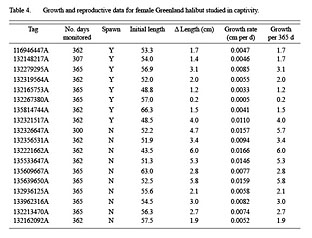
Table 4
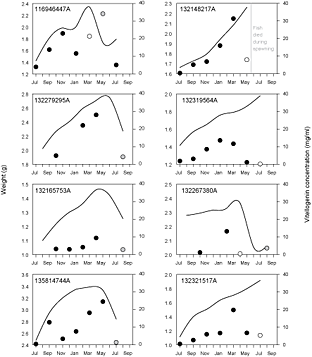
Fig. 4. Changes in whole body weight (solid line) and blood plasma vitellogenin concentration (circles) for individual experimental Greenland halibut that spawned successfully in captivity. Circle color indicates estimated maturity status based on external observations and ultrasound: solid symbol represents 'developing', white symbol represents 'spawning', and grey symbol represents 'spent'. Tag numbers are presented in the top left corner of each panel and correspond to those in Table 4. Note that the scale for weight is not uniform across panels.
|
An additional 10 fish that were transferred to the laboratory did not spawn and showed no evidence of residual hydrated oocytes when killed at the end of the experiment. Despite their failure to spawn, these fish appeared otherwise healthy (no significant lesions or fin rot and no period of dramatic negative growth). These fish did have a tendency for an initial increase in body weight followed by a period of reduced weight gain or even slight weight loss (Fig. 5) but not to the extent experienced by spawners.
Vitellogenin production
Wild fish
Plasma vitellogenin levels in wild Greenland halibut at the time of capture were strongly related to the fish’s stage of reproductive development (Fig. 6). When the most advanced oocyte size in the ovary was less than ~ 500 µm in diameter blood plasma vitellogenin levels were extremely low and showed no trend with oocyte size. As oocyte size increased there was an associated increase in plasma vitellogenin concentration, with a maximum value of ~25 mg/ml for one individual. Despite the increasing trend there was a high degree of variability and there was no clear distinction in plasma vitellogenin level between fish with and without LC oocytes. In terms of histological maturity stage, plasma vitellogenin production peaked at maturity stage 6 (i.e. late vitellogenesis) with a mean value of 13.3 mg/ml. However, no spawning (stage 7) fish were collected in the current study so it was not possible to determine if vitellogenin concentration truly peaked prior to or during spawning.
|
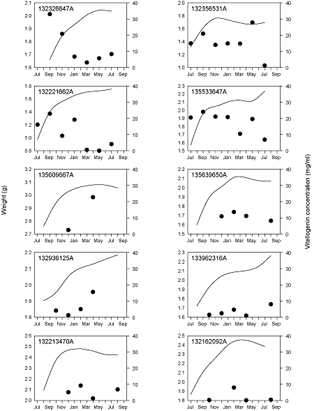
Fig. 5. Changes in whole body weight (solid line) and blood plasma vitellogenin concentration (circles) for individual experimental Greenland halibut that appeared healthy but did not successfully spawn in captivity. Tag numbers are presented in the top left corner of each panel and correspond to those in Table 4. See Fig. 4 caption for details of circle colors. Note that the scale for weight is not uniform across panels.
|
Experimental fish
There was no consistent seasonal pattern with respect to vitellogenin production in Greenland halibut (Figs. 4 and 5). However, all of the fish that spawned did demonstrate a peak in plasma vitellogenin concentration during or just prior to spawning (Fig. 4). The maximum peak value observed for any individual fish was ~35 mg/ml. Patterns were less clear among fish that did not spawn. In a couple of fish vitellogenin peaked in a similar fashion to those fish that successfully spawned. In other cases vitellogenin demonstrated no real peak or peaked early in development and then declined gradually throughout the remainder of the study (Fig. 5).
|
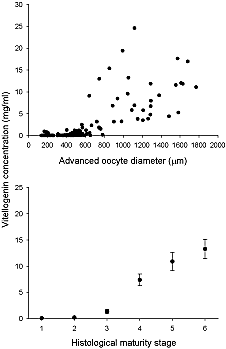 Fig. 6. Blood plasma vitellogenin concentration for Northwest Atlantic Greenland halibut in relation to (upper panel) mean oocyte diameter of the most advanced group of oocytes and (lower panel) histologically determined maturity stages. Error bars are 1 standard deviation. Fig. 6. Blood plasma vitellogenin concentration for Northwest Atlantic Greenland halibut in relation to (upper panel) mean oocyte diameter of the most advanced group of oocytes and (lower panel) histologically determined maturity stages. Error bars are 1 standard deviation.
|
Discussion
Histological data presented here support Kennedy et al.’s (2011) notion of an unusual reproductive strategy for Greenland halibut, wherein oocytes for two spawning seasons develop simultaneously. This conclusion is supported by the fact that there was no indication that the second group of oocytes remained dormant, were resorbed, or developed quicker than the leading group in order to be spawned at the same time, refuting previous suggestions (Fedorov, 1968; Junquera and Saborido-Rey, MS 1995; Rideout et al., 1999). A comparison of mean oocyte size in the LC versus the DC within the same fish (Fig. 3) suggests that oocytes in the DC are increasing in diameter 4–6 times slower than those in the LC. Hence the more rapid period of oocyte growth does not begin until after the LC separates from the DC (i.e. after a hiatus forms). Based on the time interval between the first appearance of LC oocytes and the time when maximum oocyte size was observed, Kennedy et al. (2011) estimated that this stage alone (i.e. the period of more rapid growth) requires close to a year to complete. Females with only small vitellogenic oocytes (i.e. DC), therefore, could not possibly spawn within the next 12 months but rather must be developing for the subsequent year. The simultaneous development of two cohorts of oocytes enables Greenland halibut to spawn annually despite each cohort requiring greater than one year to complete vitellogenesis. While such a strategy appears to be highly unusual among N orth Atlantic fishes, it would not appear to be unique. Numerous species of Antarctic fishes appear to utilize this strategy in order to spawn annually despite a greater than annual period required to complete vitellogenesis (e.g. Sil’yanova, 1981; Butskaya and Faleeva, 1987; Shandikov and Faleeva, 1992 and numerous Russian references cited therein; Everson, 1994). Comparing these fishes to Greenland halibut would appear to support the notion that this oocyte development pattern evolved in response to conditions that made completing vitellogenesis in a single year impossible (i.e. uncommonly large oocytes and/or low environmental temperatures; Kennedy et al. (2011)). The oocytes of these Antarctic fishes are as large as those produced by Greenland halibut and the environmental conditions are perhaps more extreme. Common wolfish Anarhichas lupus are also faced with the challenges associated with producing very large oocytes. They cope in a similar manner by always maintaining a reserve of oocytes at the cortical alveoli stage of development (Gunnarsson et al., 2006). This provides a head start to each year’s egg development but unlike Greenland halibut and Antarctic fishes, there does not appear to be any evidence that these reserve oocytes in wolfish start vitellogenesis prior to the spawning of the advanced mode of oocytes.
The unusual nature of reproductive development in Greenland halibut is an important consideration when it comes to assessing maturities in this species. Maturity scales that assume all fish with vitellogenic oocytes will spawn within the current year (e.g. the Templeman et al. (1978) scale initially developed for haddock and subsequently applied to other demersal fishes including Greenland halibut (e.g. Walsh and Bowering, 1981)) will categorize fish with only DC oocytes (i.e. without LC oocytes) as mature. Considering the reproductive strategy of this species (i.e. the continuous presence of vitellogenic oocytes once sexually mature), such fish would likely be developing oocytes for the first time (i.e. primiparous) and would be small in size relative to previously mature individuals. Such a maturity scale would therefore result in both an underestimation of the length at 50% maturity (L50) and an overestimation of spawning stock biomass (SSB) and should be rejected in favour of those that distinguish between fish with and without LC oocytes (Riget and Boje, 1989; Gundersen, 2003). Fish containing only DC oocytes might be considered biologically mature (i.e. reproductive hormones, plasma vitellogenin, etc.) but are ‘functionally immature’ from a management perspective since they would not have contributed to the current SSB.
It is important to point out that Greenland halibut populations are often not characterized by a well defined spawning period but rather can have multiple peaks in spawning activity or even some degree of spawning activity throughout the entire year (Fedorov, 1968; Junquera et al., 2003). Given the asynchrony in reproductive timing it is clear that an individual with LC oocytes and one with only DC oocytes need not spawn a full year apart (especially if oocyte sizes are not largely different, e.g. 200 µm). It would be more accurate to say that females with LC oocytes will spawn within the next twelve months whereas those with only DC oocytes would not be capable of spawning until sometime in the subsequent 12 months. This does not appear to be the case for species of Antarctic fishes, where conditions suitable for spawning likely occur over a restricted time period and result in a large degree of synchrony with respect to spawning time. For example, Notothenia coriiceps at Signy Island spawn in May each year (Everson, 1994). In such instances there is a greater degree of certainty that the two groups of vitellogenic oocytes within the ovary will be spawned a year apart.
The unusual pattern of oocyte development in Greenland halibut raises questions regarding the control mechanisms of vitellogenin production in this species. In more traditional scenarios (i.e. fish that produce only one mode of developing oocytes), a seasonal surge in reproductive hormones causes the liver to produce vitellogenin which reaches maximum levels in the blood plasma at or near spawning. After spawning, plasma vitellogenin levels fall again to almost negligible levels (e.g. Methven et al., 1992; Mosconi et al., 1998; Mandich et al., 2004). Unlike these more typical species, however, Greenland halibut contain a mode of vitellogenic oocytes even after the completion of spawning, suggesting the potential for differences in the annual vitellogenin production cycle. Interestingly, the production of vitellogenin in Greenland halibut appears to follow a very similar cycle to that described for other species. The data for wild fish showed a slightly increasing trend throughout early development (histological stages 1–3), followed by a more rapid increase in vitellogenin in prespawning fish. A general lack of spent fish in the wild samples, however, combined with a high degree of variability in plasma vitellogenin levels for captive spent fish made it difficult to resolve the overall pattern in the vitellogenin cycle following spawning.
There was also no evidence that the two coexisting cohorts of vitellogenic oocytes in Greenland halibut ovaries were dependent on unusually high levels of plasma vitellogenin. The mean plasma vitellogenin concentration at the most advanced observed stage of maturity for wild fish was less than 15 mg/ml, with individuals having values as high as 25 mg/ml. These values are very comparable with those obtained from the captive fish, although a few of the captive fish reached values as high as 35 mg/ml. It should be pointed out that no wild spawning individuals were collected during the present study so it is possible that vitellogenin levels may get higher then the maximum observed value of 25 mg/ml in wild fish as well. The maximum levels of plasma vitellogenin recorded here for Greenland halibut are much higher than levels reported in several other species (reported mean peak values: gilthead seabream Sparus aurata 1.5 mg/ml Mosconi et al., 1998; amberjack Seriola dumerilii 5 mg/ml Mandich et al., 2004; Senegalese sole Solea senegalensis 4 mg/ml Guzmán et al., 2008) but less than the maximum reported value for Atlantic halibut Hippoglossus hippoglossus (mean peak value: 56 mg/ml Methven et al., 1992). It should be noted that most of the vitellogenin levels obtained until the last decade were based on both mono and polyclonal immuno assays. Therefore, any comparison between different analytical platforms should be considered provisional until complete validation. For Greenland halibut vitellogenin, no commercial antibodies were available at the time of our studies. Nevertheless, mass spectrometry assays in this field have already been successfully validated with existing immuno assays (Simon et al., 2010; Lau et al., 2011).
It is possible that some aspects of the true pattern of vitellogenin production in Greenland halibut were masked by the fact that captive fish were only sampled every two months. For example, based on observations of the captive fish it is uncertain if vitellogenin levels peak prior to or during spawning. Vitellogenin peaked in one individual when the ovary was in a spent condition while in others it appeared to drop off while the fish was still spawning. Plasma vitellogenin concentration has been shown to peak during vitellogenesis (i.e. before spawning) in several other species, including Chinese loach Misgurnus anguillicaudatus (Lv et al., 2009), Senegalese sole (Guzmán et al., 2008), amberjack (Mandich et al., 2004) and gilthead seabream (Mosconi et al., 1998). On the other hand, vitellogenin in the more closely related Atlantic halibut peaked during spawning (Methven et al., 1992). The approach of sampling fish only every two months was taken to minimize the impacts of handling stress on the fish. The frequency of this sampling, however, was such that peaks and subsequent declines in plasma vitellogenin could easily have been missed. Our results clearly indicate that spawning activity could easily be overlooked with such a sampling routine since some fish for which spawning was not observed during the study were found to have residual oocytes at the final lethal sampling. It is suggested that future research that does not involve repeated collection of blood samples should monitor individuals more closely (i.e. at a higher frequency). Fish with largely swollen abdomens should be gently rubbed to test for the readiness of the individual to release eggs in the same manner used to monitor Atlantic halibut (Norberg et al., 1991).
In conjunction with studying the vitellogenin production cycle, the monitoring of Greenland halibut in captivity provided other typically hard to obtain data. For example, tag and recapture data have recently suggested that the growth rate of Greenland halibut may be less than half of what was previously reported (Treble et al., 2008), with current estimates for adult fish ranging from less than one cm per year (Albert et al., 2009) to three cm per year (Treble et al., 2008). Here we monitored fish over a complete year and therefore were able to provide the first data on growth in captivity. These data appear to corroborate the published tag-recapture data with growth over the year averaging 3.87 ± 1.64 cm for females that did not spawn but only 1.92 ± 1.16 cm for those females that spawned successfully, likely due to a trade-off between growth and reproduction (Roff, 1983; Lambert and Dutil, 2000; Jørgensen and Fiksen, 2006).
Failure of fish to spawn in captivity is not a novel finding, and is perhaps not unexpected for a species that has never been maintained in captivity before and for which husbandry practices have not been refined. For example, Ndjaula et al. (2009) reported that horse mackerel Trachurus trachurus held in captivity underwent vitellogenesis but did not complete oocyte maturation and did not spawn. Failure of Greenland halibut to spawn in captivity, however, is not necessarily linked to unsuitable conditions, especially since some fish did spawn successfully. It is possible that at least some of the fish that did not spawn may have been developing for the first time but were still within their first year of development and hence did not spawn during the one year observation period. It has been suggested that this so-called adolescent period may be even longer than one year in Greenland halibut (Junquera et al., 2003; Simonsen and Gundersen, 2005). For example, Junquera et al. (2003) reported that there was a time lag of four years between when cortical alveoli first appeared in Greenland halibut oocytes and when they first spawned. Wolffish Anarhichas lupus are an even more extreme case with a reported adolescent phase of 8–10 years in Icelandic waters (Gunnarsson et al., 2006). It is also possible that fish started to ripen but subsequently stopped and resorbed any oocytes that had started to develop. The continuous atresia of oocytes with cortical alveoli or just beginning vitellogenesis appears to be very common for wild Greenland halibut (Fedorov, 1968; Walsh and Bowering, 1981; Junquera et al., 1999; Tuene et al., MS 2001) and thus would not necessarily be an artifact of captive conditions. The fact that plasma vitellogenin levels sometimes were relatively high at the start of the experiment and subsequently declined would appear to support the notion of vitellogenesis beginning and then being interrupted.
Many questions remain pertaining to Greenland halibut reproduction. The unusual oocyte development pattern has clear implications for estimating SSB and the potential for correcting previously collected data is unknown. Further work is needed to explore effective methods for estimating maturity status, the quantitative relationship between LC and DC oocytes, linkages between reproductive strategy, reproductive potential, fish energetic status and environmental conditions, and how the unusual oocyte development pattern influences the reproductive potential of Greenland halibut stocks. Continued refinements in husbandry and experimental protocols for the study of Greenland halibut in captivity should provide a means to answer some of these questions.
Acknowledgements
Funding for this project was provided by Fisheries and Oceans Canada through its International Governance Strategy and through the Canada-Spain Marine Collaboration Initiative. Many thanks to the sea-going staff of Fisheries and Oceans Canada as well as the Captains and crews of the vessels CCGS Teleost, the fishing vessels Atlantic Challenger and Atlantic Traveler, and the Greenland Institute of Natural Resources RV Paamiut. Many thanks also to the captain and crew of the fishing vessel “Alberto” for the capture of live specimens of Greenland halibut. Technical assistance for the mass spectrometry work was provided by F. Jahouh and S. Sioud. The experiment with live fish was conducted in compliance with the current laws of the Canadian Council on Animal Care.
References
ALBERT, O. T., M. KVALSUND, T. VOLLEN and A. SALBERG. 2009. Towards accurate age determination of Greenland halibut. J. Northw. Atl. Fish. Sci., 40: 81–95.
BOJE, J. 2002. Intermingling and seasonal migrations of Greenland halibut (Reinhardtius hippoglossoides) populations determined from tagging studies. Fish. Bull., 100: 414–422.
BOWERING, W. R. 1984. Migrations of Greenland halibut, Reinhardtius hippoglossoides, in the Northwest Atlantic from tagging in the Labrador–Newfoundland region. J. Northw. Atl. Fish. Sci., 5: 85–91. http://dx.doi.org/10.2960/J.v5.a11
BOWERING, W. R. and G. R. LILLY. 1992. Greenland halibut (Reinhardtius hippoglossoides) off southern Labrador and northeastern Newfoundland (Northwest Atlantic) feed primarily on capelin (Mallotus villosus). Neth. J. Sea Res., 29: 211–222. http://dx.doi.org/10.1016/0077-7579(92)90021-6
BUTSKAYA, N. A. and T. I. FALEEVA. 1987. Seasonal changes in the gonads and fecundity of Antarctic Fishes Trematomus bernacchii, Trematomus hansoni and Pagothenia borchgrevinki (Nototheniidae). J. Ichthyol., 27: 27–36.
COHEN, A. M., F. JAHOUH, S. SIOUD, R. M. RIDEOUT, M. J. MORGAN and J. H. BANOUB. 2009. Quantification of Greenland halibut serum vitellogenin: a trip from the deep sea to the mass spectrometer. Rapid Commun. Mass Spectrom., 23: 1049–1060. http://dx.doi.org/10.1002/rcm.3966
DE GROOT, S. J. 1970. Some notes on an ambivalent behaviour of Greenland halibut Reinhardtius hippoglossoides (Walb.). Pisces: Pleuronectiformes. J. Fish Biol., 2: 275–279. http://dx.doi.org/10.1111/j.1095-8649.1970.tb03285.x
DENNARD, S. T., B. C. MCMEANS and A. T. FISK. 2009. Preliminary assessment of Greenland halibut diet in Cumberland Sound using stable isotopes. Polar Biol., 32: 941–945. http://dx.doi.org/10.1007/s00300-009-0624-3
EVERSON, I. 1994. Timescale of ovarian maturation in Notothenia coriiceps; evidence for a prolonged adolescent phase. J. Fish Biol., 44: 997–1004. http://dx.doi.org/10.1111/j.1095-8649.1994.tb01271.x
FEDOROV, K. Y. 1968. Ovogenez i polovoi tsikli chernogo paltusa. Trudy PINRO 23: 425–450. [Oogenesis and sexual maturity of the Greenland halibut. Canadian Fisheries and Aquatic Sciences Translation No. 4559, 1979.]
GUNDERSEN, A. C. 2003. Sexual maturity, fecundity and nursery grounds of Northeast Arctic Greenland halibut (Reinhardtius hippoglossoides (Walbaum)). Ph.D. Thesis. Department of Fisheries and Marine Biology, University of Bergen, Norway.
GUNDERSEN, A. C., C. STENBERG, I. FOSSEN, B. LYBERTH, J. BOJE and O. A. JORGENSEN. 2010. Sexual maturity cycle and spawning of Greenland halibut Reinhardtius hippoglossoides in the Davis Strait. J. Fish Biol., 77: 211–226. http://dx.doi.org/10.1111/j.1095-8649.2010.02671.x
GUNNARSSON, Á., E. HJORLEIFSSON, K. THORARINSSON and G. MARTEINSDOTTIR. 2006. Growth, maturity and fecundity of wolffish Anarhichas lupus L. in Icelandic waters. J. Fish Biol., 68: 1158–1176. http://dx.doi.org/10.1111/j.0022-1112.2006.00990.x
GUZMAN, J. M., B. NORBERG, J. RAMOS, C. C. MYLONAS and E. L. MANANOS. 2008. Vitellogenin, steroid plasm levels and spawning performance of cultured female Senegalese sole (Solea senegalensis). Gen. Comp. Endocrinol., 156: 285–297. http://dx.doi.org/10.1016/j.ygcen.2008.02.002
JORGENSEN, C. and Ø. FIKSEN. 2006. State–dependent energy allocation in cod (Gadus morhua). Can. J. Fish. Aquat. Sci., 63: 186–199. http://dx.doi.org/10.1139/f05-209
JUNQUERA, S., E. ROMAN, M. J. MORGAN, M. SAINZA and G. RAMILO. 2003. Time scale of ovarian maturation in Greenland halibut (Reinhardtius hippoglossoides, Walbaum). ICES J. Mar. Sci., 60: 767–773. http://dx.doi.org/10.1016/S1054-3139(03)00073-0
JUNQUERA, S., E. ROMAN, X. PAZ and G. RAMILO. 2003. Time scale of ovarian maturation in Greenland halibut (Reinhardtius hippoglossoides, Walbaum). . 1999. Changes in Greenland halibut growth, condition and fecundity in the Northwest Atlantic (Flemish Pass, Flemish Cap and Southern Grand Bank). J. Northw. Atl. Fish. Sci., 25: 17–28. http://dx.doi.org/10.2960/J.v25.a2
JUNQUERA, S. and F. SABORIDO-REY. MS 1995. Histological assessment of sexual maturity in the Greenland halibut in Div. 3LM. NAFO SCR Doc., No. 28, Serial No. N2537, 9 p.
JUNQUERA, S. and J. ZAMARRO. MS 1992. Sexual maturity and spawning of the Greenland halibut (Reinhardtius hippoglossoides) from Flemish Pass area. NAFO SCR Doc., No. 41, 10 p.
KENNEDY, J., A. C. GUNDERSEN, Å. HOINES and O. S. KJESBU. 2011. Greenland halibut (Reinhardtius hippogolossoides) spawn annually but successive cohorts of oocytes develop over two years, complicating correct assessment of maturity. Can. J. Fish. Aquat. Sci., 68: 201–209. http://dx.doi.org/10.1139/F10-149
LAMBERT, Y. and J. D. DUTIL. 2000. Energetic consequences of reproduction in Atlantic cod (Gadus morhua) in relation to spawning level of somatic energy reserves. Can. J. Fish. Aquat. Sci., 57: 815–825. http://dx.doi.org/10.1139/f00-022
LAU, T. Y., B. C. COLLINS, P. STONE, N. TANG, W. M. GALLAGHER and S. R. PENNINGTON. 2011. Absolute quantification of toxicological biomarkers by multiple reaction monitoring. Methods Mol. Biol., 691: 417–427. http://dx.doi.org/10.1007/978-1-60761-849-2_25
LV X., J. SHAO, Q. ZHOU M. SONG and G. JIANG. 2009. Circannual vitellogenin levels in Chinese loach (Misgurnus anguillicaudatus). Environ. Biol. Fishes, 85: 23–29. http://dx.doi.org/10.1007/s10641-007-9310-x
MANDICK, A., A. MASSARI, S. BOTTERO, P. PIZZICORI, H. GOOS and G. MARINO. 2004. Plasma sex steroid and vitellogenin profiles during gonad development in wild Mediterranean amberjack (Seriola dumerilii). Mar. Biol., 144: 127–138. http://dx.doi.org/10.1007/s00227-003-1185-6
MATTSON, N. S. and T. H. RIPLE. 1989. Metomidate, a better enesthetic for cod (Gadus morhua) in comparison with benzocaine, MS–222, chlorobutanol, and phenoxyethanol. Aquaculture, 83: 89–94. http://dx.doi.org/10.1016/0044-8486(89)90063-X
METHVEN, D. A., L. W. CRIM, B. NORBERG, J. A. BROWN, G. P. GOFF and I. HUSE. 1992. Seasonal reproduction and plasma levels of sex steroids and vitellogenin in Atlantic halibut (Hippoglossus hippoglossus). Can. J. Fish. Aquat. Sci., 49: 754–759. http://dx.doi.org/10.1139/f92-084
MOSCONI, G., O. CARVEVALI, R. CARLETTA, M. NABISSI and A. M. POLZONETTI-MAGNI. 1998. Gilthead seabream (Sparus aurata) vitellogenin: Purification, partial characterization, and validation of an enzyme-linked immunosorbent assay. Gen. Comp. Endocrinol., 110: 252–261. http://dx.doi.org/10.1006/gcen.1998.7075
MURUA, H. and F. SABORIDO-REY. 2003. Female reproductive strategies of marine fish species of the North Atlantic. J. Northw. Atl. Fish. Sci., 33: 23–31. http://dx.doi.org/10.2960/J.v33.a2
NAFO, 2011. Part B – Report of the June Meeting. NAFO Scientific Council Reports, 2010.
NDJAULA, H. O. N., T. HANSEN, M. KRUGER-JOHNSON and O. S. KJESBU. 2009. Oocyte development in captive Atlantic horse mackerel Trachurus trachurus. ICES J. Mar. Sci., 66: 623–630. http://dx.doi.org/10.1093/icesjms/fsp032
NORBERG, B., V. VALKNER, J. HUSE, I. KARLSEN and G. L. GRUNG. 1991. Ovulatory rhythms and egg viability in the Atlantic halibut (Hippoglossus hippoglossus). Aquaculture 97: 365–371. http://dx.doi.org/10.1016/0044-8486(91)90328-5
RIDEOUT, R. M., D. M. MADDOCK and M. P. M. BURTON. 1999. Oogenesis and the spawning pattern in Greenland halibut from the Northwest Atlantic. J. Fish Biol., 54: 196–207. http://dx.doi.org/10.1111/j.1095-8649.1999.tb00623.x
RIGET, F. and J. BOJE. 1989. Fishery and some biological aspects of Greenland halibut (Reinhardtius hippoglossoides) in West Greenland waters. NAFO Sci. Coun. Studies, 13: 41–52.
ROFF, D. A. 1983. An allocation model of growth and reproduction in fish. Can. J. Fish. Aquat. Sci., 40: 1395–1404. http://dx.doi.org/10.1139/f83-161
SHANDIKOV, G. A. and T. I. FALEEVA. 1992. Features of gametogenesis and sexual cycles of six notothenoid fishes from East Antarctica. Polar Biol., 11: 615–621. http://dx.doi.org/10.1007/BF00237956
SIL’YANOVA, Z. S. 1981. Oogenesis and stages of maturity of fishes of the familiy nototheniidae. J. Ichthyol., 21: 81–89.
SIMON, R., G. JUBEAUX, A. CHAUMOT, J. LEMOINE, O. GEFFARD and A. SALVADOR. 2010. Mass spectrometry as an alternative to the enzyme-linked immunosorbent assay test for biomarker quantitation in ecotoxicology: Application to vitellogenin in Crustacea (Gammarus fossarum). J. Chromatrogr. A 1217: 5109–5115. http://dx.doi.org/10.1016/j.chroma.2010.06.015
SIMONSEN, C. S. and A. C. GUNDERSEN. 2005. Ovary development in Greenland halibut Reinhardtius hippoglossoides in west Greenland waters. J. Fish Biol., 67: 1299–1317. http://dx.doi.org/10.1111/j.1095-8649.2005.00825.x
SPECKER, J. L. and C. V. SULLIVAN, (1994). Vitellogenesis in fishes: status and perspectives. In Perspective in Comparative Endocrinology. Davey, K. G., Peter, R. E. and Tobe, S. S., (eds). National Research Council Canada, Ottawa, Canada, p. 304–315.
SUN, B. and N. W. PANKHURST. 2003. Correlation between oocyte development and plasma concentrations of steroids and vitellogenin in greenback flounder Rhombosolea tapirina. Fish Physiol. Biochem., 28: 367–368. http://dx.doi.org/10.1023/B:FISH.0000030592.83257.59
TEMPLEMAN, W. 1973. Distribution and abundance of the Greenland halibut, Reinhardtius hippoglossoides (Walbaum), in the Northwest Atlantic. ICNAF Res. Bull., 10: 83–98.
TEMPLEMAN, W., V. M. HODDER and R. WELLS. 1978. Sexual maturity and spawning in haddock, Melanogrammus aeglefinus, of the southern Grand Bank. ICNAF Res. Bull., 13: 53–65.
TREBLE, M. A., S. E. CAMPANA, R. J. WASTLE, C. M. JINES and J. BOJE. 2008. Growth analysis and age validation of a deepwater Arctic fish, the Greenland halibut (Reinhardtius hippoglossoides). Can. J. Fish. Aquat. Sci., 65: 1047–1059. http://dx.doi.org/10.1139/F08-030
TUENE, S., A. C. GUNDERSEN, W. EMBLEM, I. FOSSEN, J. BOJE, P. STEINGRUND and L. H. OFSTAD. MS 2001. Maturation and occurrence of atresia in oocytes of Greenland halibut (Reinhardtius hipploglossoides, Walbaum). NAFO SCR Doc., No. 166, Serial No. N4561, 12 p.
TYLER, C. R., SANTOS, E. M. and PRAT, F. (2000). Unscrambling the egg-cellular, biochemical, molecular and endocrine advances in oogenesis. In: Proceedings of the 6th International Symposium on the Reproductive Physiology of Fish. Norberg, B., Kjesbu, O. S., Taranger, G. L., Andersson, E. and Stefansson, S. O., (eds). Bergen: Fish Symp 99, p. 273–280.
TYLER, C. R. and J. P. SUMPTER. 1996. Oocyte growth and development in teleosts. Rev. Fish Biol. Fish. 6: 287–318. http://dx.doi.org/10.1007/BF00122584
VOLLEN, T. and O. T. ALBERT. 2008. Pelagic behaviour of adult Greenland halibut (Reinhardtius hippoglossoides). Fish. Bull., 106: 457–470.
WALLACE, R. A. (1985). Vitellogenesis and oocyte growth in non-mammalian vertebrates. In: Developmental Biology: A Comprehensive Synthesis. Vol. 1. Oogenesis. Browder, L. W., (ed). New York: Plenum Press, p. 127–177.
WALLACE, R. A. and K. SELMAN. 1981. Cellular and dynamic aspects of oocyte growth in teleosts. Amer. Zool., 21: 325–343.
WALSH, S. J. and W. R. BOWERING. 1981. Histological and visual observations on oogenesis and sexual maturity in Greenland halibut off northern Labrador. NAFO Sci. Coun. Studies 1: 71–75.
|