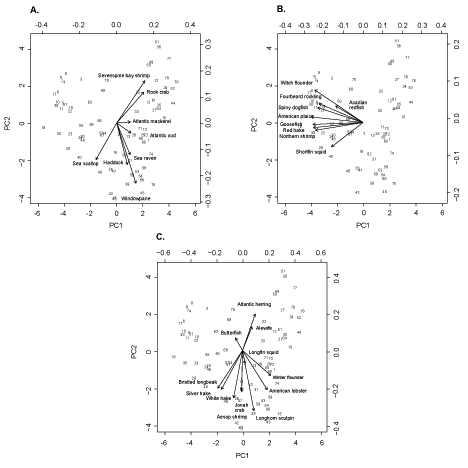
| Fig. 9. Plots of principal component analysis results of fish survey data during the autumn 2003 survey. The arrows represent eigenvectors of each species and the numerical codes represent scores for 78 sampling stations, (A) species subgroup 1, (B) species subgroup 2, and (C) species subgroup 3. |