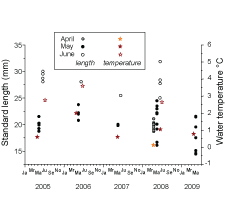
| Fig. 3. Greenland halibut larva size (each circle represents one larva) for each ichthyoplankton survey between 2005 and 2009 and mean water temperature in the upper 50 m of the water column for each survey (stars). |
| Fig. 3. Greenland halibut larva size (each circle represents one larva) for each ichthyoplankton survey between 2005 and 2009 and mean water temperature in the upper 50 m of the water column for each survey (stars). |