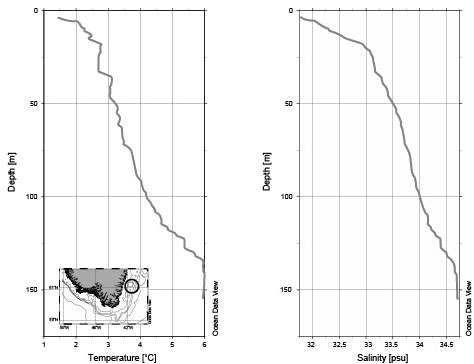
Fig. 3a. Vertical profiles of temperature [°C] and salinity [psu]; left: station 1296 (2004) East Greenland.