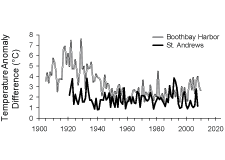
| Fig. 6. The annual difference between the maximum and minimum of the monthly mean temperature anomalies for Boothbay Harbor and St. Andrews, N.B. |
| Fig. 6. The annual difference between the maximum and minimum of the monthly mean temperature anomalies for Boothbay Harbor and St. Andrews, N.B. |