|
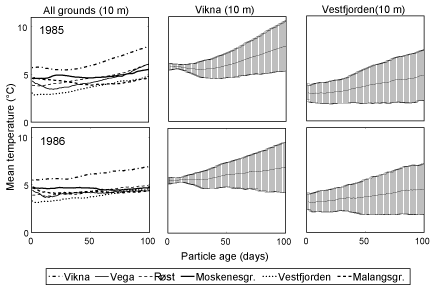
Fig. 4. Mean temperature exposures for particles released at all cod spawning grounds (left panels), with the standard deviation plotted for the highest (centre panels) and lowest (right panels) mean temperature trajectories for the years 1985 (upper panels) and 1986 (lower panels). |
|