|
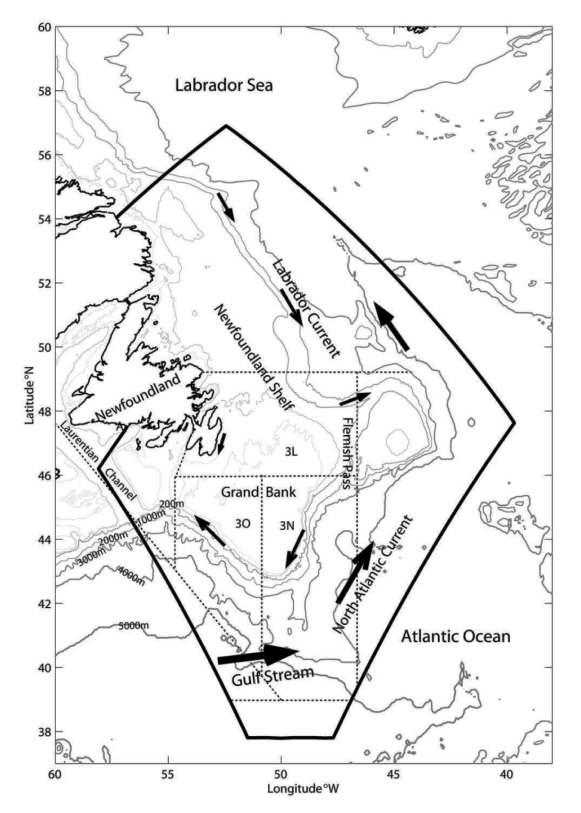
Fig. 1. Map showing the study area. Dotted lines delineate NAFO Divisions. The thick solid lines depict the open boundary locations of the ocean circulation model. Arrows identify the strength and direction of the currents. |
|
|
Fig. 1. Map showing the study area. Dotted lines delineate NAFO Divisions. The thick solid lines depict the open boundary locations of the ocean circulation model. Arrows identify the strength and direction of the currents. |
|