|
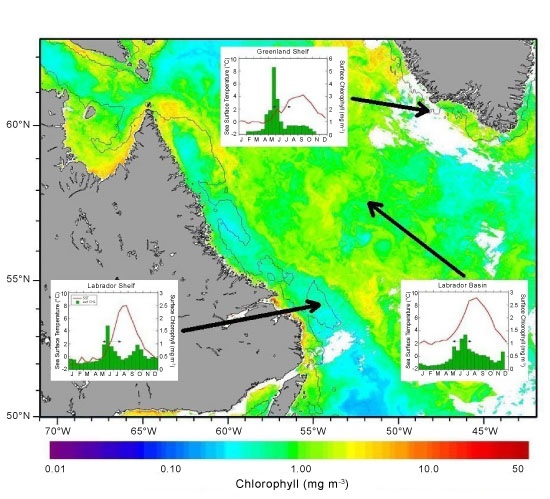
Fig. 1. Sea-viewing Wide Field-of-view Sensor (SeaWiFS) ocean colour composite image (July) of the Labrador Sea and surrounding waters. Inset graphs show average (1998–2004) twice-monthly satellite (AVHRR) sea surface temperature, SST, ºC (red lines) and SeaWiFS surface chlorophyll concentration, mg m-3 (green vertical bars) for: (lower left) the Labrador Shelf, (lower right) central Labrador basin and (top center) Greenland Shelf, see also Fig. 3. Horizontal lines in inset graphs indicate period of spring/summer LSMP observations. |
|