|
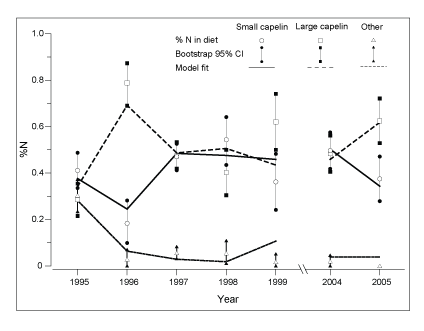
Fig. 9. Fit of the ecological model to the diet data. The circles, squares and triangles are point estimates of the percent by number that small capelin (100–140 mm), large capelin (>140 mm) and other prey represent in the diet of common murre, respectively. The bars indicate bootstrap 95% CI and the lines represent the model fit. |
|