Introduction
Baffin Bay is separated from the Arctic Basin to the north by a narrow, shallow (<200 m) ridge in the Nares Strait that likely acts as a barrier for certain Arctic deep-water fishes (Fig. 1). To the south, the “Greenland-Canada Ridge” underlying the Davis Strait between Greenland and Baffin Island separates a “cold” basin centered in Baffin Bay and the “warm” Labrador Sea (Riis-Carstensen, 1948). Baffin Bay is thus the most isolated of the seas of the Arctic Ocean (Fig. 1).
Surface waters of Baffin Bay are about 0°C. Beneath the surface there is a >100 m thick layer of water <0°C. At 400–500 m and a third layer with temperatures as high as 2.2°C. Below 500 m, the temperature decreases and negative values are often observed (Buch, 2000). The hydrographic conditions in the Baffin Bay are primarily influenced by the West Greenland Current that flows into the eastern part of Baffin Bay as a weak, relatively warm current that cools and weakens as it flows northwards. The east coast of Baffin Island is dominated by the cold Polar Current, which originates in the Arctic Basin and flows southward along the coast.
These conditions result in demersal species assemblages that differ from adjacent areas as determined by Jørgensen et al. (2005) who described and mapped fish diversity in the Davis Strait and southern Baffin Bay. That study identified seven assemblages of which four were located solely in the Baffin Bay. Two were primarily located in the Davis Strait but also spread into the southeastern part of the Baffin Bay, probably due to the influence of the relatively warm West Greenland Current.
Based on two surveys carried out in 2004, using the same vessel, sampling scheme and analytical methods, the present study supplements and spatially extends the 2005 study to describe and quantify for the first time, the fish assemblages in the northern Baffin Bay and to provide a good baseline material in a region that is experiencing and will continue to experience large environmental changes owing to climate change. For an introduction to previous research conducted in the area see Jørgensen et al. (2005).
Materials and Methods
Two depth stratified random bottom trawl surveys were conducted in Baffin Bay between 72° 02' N and 76° 55' N, with a total of 105 valid stations (Fig. 1). Both surveys were conducted by the Paamiut (722 gross tons), using an Alfredo III bottom trawl with a mesh size of 140 mm and a 30-mm mesh-liner in the cod-end, and a rock hopper type ground gear. Wing spread was approximately 20 m, net height 5.6 m, towing speed around 3 knots and towing time between 15 and 30 min. The exact wingspread, towing speed and towing time was recorded for each tow conducted at each station. Further information about trawl and gear is given in Jørgensen (MS 1998).
The depth of the trawling ranged from 340–1 418 m in most of the survey area, except for three hauls up to 151 m off Northwest Greenland. During 4–12 September 2004, 43 stations were sampled in the western part of Baffin Bay (Treble, MS 2005), while the remaining 62 stations were sampled between 22 September and 7 October 2004, in eastern Baffin Bay (Jørgensen, MS 2005) (Fig. 1). Near-bottom temperatures were measured at all trawl stations, in 0.1°C increments, by a Seamon sensor mounted on a trawl door. The catch at each station was sorted by species, counted and weighed to the nearest 0.1 kg. In total, five species considered as pelagic according to Whitehead et al. (1984–1986) were excluded from the analyses because pelagic species are better monitored by acoustics and pelagic trawl and an unknown fraction of the captured specimens might have been taken during setting and hauling of the trawl (Table 1).
Abundance estimates were standardized to 1 km2 swept area prior to further calculations using the exact wing spread, towing speed and towing time. The catchability is unknown and likely varies from species to species but in the present analysis it is set to 1.0, i.e., all demersal fish in the trawled area were caught.
To identify fish assemblages within the survey area and to construct a map of their distribution, we apply an approach somewhat similar the one proposed by Souissi et al. (2001). By means of a Bayesian multinomial logit model (Congdon, 2001) we quantify the probability that individual samples (trawl hauls), characterized by the particular composition of species and their abundances, belong to each of the groups of hauls as defined by a multivariate cluster analysis. Each haul could thus be characterized by a geographical position and a vector of group membership probabilities. This provided the basis for drawing a continuous map of distribution using kriging.
Greenland halibut (Reinhardtius hippoglossoides) and the sea snail Liparis fabricii were very common and represented dominant numbers in almost all trawl hauls. These two species were, respectively, about 100 and 10 times more abundant than the remaining species. Thus, they dominated the outcome of the first run of the analysis and made it difficult to identify any clear assemblages. The two species were therefore removed from further analysis to allow for a definition of assemblages for the remaining species and their distributions were mapped separately (Fig. 2).
To reduce “noise”, we selected only demersal species that represented in more than 5% of the tows for analyses. The sum of the total abundance was estimated and species contributing more than 1.3% of the total sum were considered as primary species (n = 14), whereas the remaining were classified as secondary species (n = 5). The remaining 19 rare species, of the 40 demersal species recorded, are not included in the analyses, but ranges of recorded depth, temperature and latitude are provided for all species in Table 1.
Three stations were excluded from the assemblage analysis because they did not include any “Primary species” (see above) and four stations were excluded from the cluster analysis (see above) because they came out as outliers because they only contained one or few specimens of one primary species. In total, 98 stations were hence used for further analysis.
Cluster analysis
The cluster analysis is a numerical rather than a statistical procedure and no assumption of normality is required. However, the data were transformed by a double square root in order to stabilize the variance and hence make the cluster analysis more robust. Further, the fourth root transform handles zeroes quite well as compared to log transforms which requires adding a subjectively chosen positive.
In the first step, the individual trawl hauls represented by data vectors (root four transformed counts of individuals of the 14 primary species per km2 were analyzed by multivariate cluster analysis using the Primer software v. 5.2 (Primer, 2001). The similarity coefficients between sites (trawl stations) were estimated by means of the Bray-Curtis clustering method (Legendre and Legendre, 1998).
The hierarchical tree obtained from the cluster analysis was split stepwise into an increasing number of “cut off levels”, each time expanding the spatial organization patterns of the assemblages by one (i.e., the first “cut off level” split the data set in two clusters, the second in three and so on). The procedure was stopped when there was no further increase in the “indicator values” (see Characterization of the assemblages (indicator values) below) indicating that no additional information was obtained by further subdividing the data set.
Bayesian multinomial logit mode
Once the numbers of clusters and their members have been determined, a probability that an individual haul is drawn from each of the clusters can be calculated. This was done using Bayesian multinomial logit model (Congdon, 2001).
The data, Xi,m, are vectors of integers counting the number of individuals of fish species m found in sample i. The data vectors were assigned membership to one of k groups defined by the initial cluster analyses as described above. Each data vector was assumed to be a random draw from a particular multinomial distribution:
 (1) (1)
where ~ means “distributed as”, multi(pk,i,m, nk,i) is the multinomial distribution with the parameters pk,i,m and nk,i. pk,i,m is the probability vectors and nk,i is total number of individuals found in the sample. The number of data elements in the kth group, and k, itself depends on the chosen cutoff level, C, used in the cluster analysis. Thus the index i is restarted for each group k, i.e.  . .
pk,i,m, were modeled as logit transformed multivariate normal variables, hk,i,m:
 (2) (2)
and
where multiN is the multinormal distribution. A reference prior for hk,i,m with 0 as the baseline was given from:
 (3) (3)
where νk,m,=0 and the precision matrices Wk–1 have 0.01 on the leading diagonal and zeroes elsewhere for the correlations. The precision matrices were given a Wishart distribution (wish):
 (4) (4)
where the matrices Rm,m for each value of k was given a leading diagonal of 1’s and 0’s otherwise (Congdon, 2001).
The within cluster probability vectors πk,m were then derived from μk,m by inverse logistic transformation:
 (5) (5)
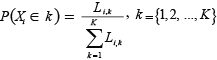
and the probabilities of a station belonging to one of the k clusters was calculated as the probability of randomly drawing the particular station from a multinomial distribution with the parameters πk,m, nk,i. The contribution of the ith station to the kth multinomial likelihood (ignoring constants), has the form:
 (6) (6)
which was then normalized to give actual probabilities with the character of summing to 1 and thus:
Posterior samples of these probabilities were generated by Monte Carlo Markov Chain (MCMC) sampling methods (e.g., Congdon, 2001). The programming framework WinBugs v.1.4, (www.mrc-bsu.cam.ac.uk/bugs; Gilks et al., 1994; Spiegelhalter et al., 2000), provided a means of specifying and analyzing Bayesian models, including selection and implementation of appropriate algorithms. For numerical integration WinBugs uses “Metropolis-Hastings within Gibbs sampling” (Gilks et al., 1996, see also www.mrc-bsu.cam.ac.uk/bugs).
Mapping of regionalizied variables
WinBugs was set up to do 11 000 iterations. The first 1 000 samples of the recorded chain were discarded for “burn-in” leaving 10 000 samples as the final result. Convergence diagnostics were calculated and evaluated to confirm that the model and sampling set-up was appropriate to ensure convergence.
Based on the estimated median probabilities hauls were reallocated to the cluster to which they showed the highest probability of membership. The model was then re-run and the procedure repeated until the allocation of stations was stable.
Spatial distribution of assemblages
A map of assemblage distribution could be constructed from the estimated probability vectors assigned to the geographical position of the haul. An interpolated regular grid, 0.025 longitude by 0.025 latitude degrees, was obtained by using a spherical variogram model and the kriging method (Matheron, 1962; Souissi et al., 2001).
The kriging procedure provides estimates far from points with observations and thus also for areas that cannot be considered represented by the survey. Hence we have chosen to mask the maps of the conditional probabilities at approximately the 200 and 1 600 m depth contours (a few hundred meters beyond the area covered by most of the surveys) except in the northeastern part of Baffin Bay where some shallow stations were sampled. Areas within the 200–1 600 m depth contours but far from stations have also been masked. All stations have a probability to belong to one of the five clusters, although it often is very low. In order to avoid up to five different colors on top of each other and hence a very blurred picture, areas with less than 15% conditional probability have been removed to improve the graphical representation.
Characterization of the assemblages (indicator values)
Dufrêne and Legendre (1997) defined an index which was maximum (100%) when the individuals of a particular species are observed in all sites (trawl hauls) of only one assemblage; therefore the indicator value (IV) for any given species will be highest for the assemblage where it occurs in the greatest number of sites and this species could then be considered an “indicator species” for that assemblage. The indicator values were calculated for all primary and secondary species across all “cut-off levels” and assemblages after the reallocation of hauls (see “Mapping of regionalized variables” above).
The indicator values were also used to assess the benefit of adding additional “cut-off-levels” to the initial cluster analysis. When no increase in indicator value was observed for any species no additional “cut-off-levels” were applied.
Results
A total of 45 fish species were recorded during the surveys, of which five were considered pelagic and excluded from the analyses (Table 1). 27 species were recorded in the western part of the Baffin Bay while 41 species were recorded in eastern part.
Of the 18 species found exclusively in the eastern part of the survey area waters were five sculpins and three lumpsuckers. The only species that was found exclusively in the eastern part of the survey area in significant numbers was Arctogadus glacialis. The remaining species as for example Alepocephalus agassizii, Benthosema glaciale and Sebastes mentella occurred all in small numbers and are species also found further south.
The four species found exclusively in the western part of the survey area were all observed only in few numbers. Notacanthus cemnitzii and Rajella bathyfila are also found south of the survey area. The other two species were Lycenchelys sp. and Cotunculus sadko. The status of the latter species and the differences to Cotunculus microps is, however uncertain (Yabe, 1995).
The cluster analysis based on the 14 primary species (demersal species represented in more than 5% of the tows and contributing more than 1.3% of the total sum but excluding R. hippoglossoides and the sea snail L. fabricii) defined five groups of hauls with similar species composition and density. The indicator values calculated for each species (before the reallocation of stations) within these five clusters suggested that no additional information could be obtained by further separating the data i.e., the maximum indicator value observed for any given species did not increase by adding another “cut-off level”.
The reallocation of hauls to the cluster to which they showed the highest probability of membership resulted in five different assemblages with a rather well defined geographic distribution and, in most cases, differences in mean depth and temperature or both.
One assemblage (Assemblage 1) is mainly located off Northwest Greenland but is also represented at one station in Canadian waters (Fig. 3, Tables 2 and 3) in shallow (average depth = 459 m) and cold water (average temperature = 0.4ºC). The small sculpin Triglops nybelini (IV = 59.0) and Leptagonus decagonus (IV = 49.1) are primary indicator species for this area where Artediellus atlanticus is also abundant. The assemblage is also characterized by the absence of nine of the primary species (Tables 3 and 4). The only secondary species represented in this area is Lycodes reticulatus (IV = 41.3) that also has its highest indicator value here.
Deeper, on the upper slope (average depth = 541 m) primarily in the northern and in the central western part of the survey areas (Fig. 4) there is an assemblage (Assemblage 3) associated with cold water (average temp = 0.5°C) (Table 2). Assemblage 3 is characterized by A. atlanticus (IV = 42.3) and separated from Assemblage 1 by the absence of L. decagonus and very few T. nybelini and from the slightly deeper Assemblage 2 (see below) by the absence of Amblyraja radiata and Careproctus reinhardti and a number of other primary species (Table 3).
Assemblage 2 (average depth = 652 m and average temperature = 0.9 °C) is characterized by the primary indicator species C. reinhardti (IV = 79.3) and A. radiata (IV = 54.2) but also with a high presence of C. microps and Lycodes seminudus (Fig. 5; Tables 2 and 3).
The slopes facing the central part of Baffin Bay contain two assemblages. In the shallower one (Assemblage 4) (average depth = 836 m and average temperature = 0.7°C) (Fig. 6; Tables 2 and 3) the two eel pouts Lycodes mcallister (IV = 35.7) and Lycodes eudipleurostictus (IV = 23.4) are primary indicator species and the eel pout Lycodes paamiuti is a secondary indicator species. R. hippoglossoides, which was not included in the analysis (see Methods and Discussion), is also very abundant at this depth (Jørgensen, MS 2005; Treble, MS 2005).
The deepest assemblage in Baffin Bay (Assemblage 5) (average depth = 1088 m and average temperature = 0.4°C) (Fig. 7, Tables 2 and 3) is characterized by the primary indicator species Paraliparis bathybiusi (IV = 47.8) and Rhodichthys regina (IV = 34.4) and the secondary indicator species Lycodes adolfi (IV = 15.6). The assemblage is primarily separated from the former assemblage by the presence of the three indicator species, which are virtually missing in the shallower assemblage.
A number of indicator species cannot be grouped within a particular assemblage but are more or less wide spread throughout the Baffin Bay. This applies to primary species Amblyraja hyperborea (IV = 76.9), C. microps (IV = 39.6) and L. seminudus (IV = 33.2) found outside the area covered by Assemblage 1 (Table 3). These species can be considered generalists (eurytrophic).
Other species could be assigned to the deeper part of the Baffin Bay (Assemblage 4 and 5) where the primary species Gaidropsaurus ensis (IV = 68.7) and Macrourus berglax (IV = 23.4) are indicator species, while the secondary species Careproctus micropus (IV = 12.7) and C. sadko (IV = 9.1) also have their main distribution here, although they are not very abundant.
Depth and temperature are often considered as proxies for other ecological factors. The temperatures ranged from -0.5–+1.8°C, and the mean temperatures in the five assemblages ranged from 0.36–0.94°C (Table 2). There were only statistically significant difference (95% level) in mean temperature between Assemblages 2 and 5 and Assemblages 4 and 5. The depth ranged from 152–1 419 m and there was no statistical difference in mean depth in the three shallow assemblages (Assemblages 1–3) while they were all significantly different (95% level) from Assemblages 4 and 5. The difference in mean depth was also statistically significant for these two deep assemblages.
In Fig. 8, the maps in Figs. 3–7 are combined in order to present a total distribution map of the five different fish Assemblages recognized in the survey area. Most of the Assemblages are rather well defined except Assemblage 3 (Fig. 4) that is primarily located in the central eastern part and north eastern part of the part investigated area. This assemblage mixes to some extent with Assemblage 2 (Fig. 5). There is also some mixture between Assemblage 4 and 5 on the northern slope of the Baffin Bay (Figs. 6 and 7).
The relative probability (eq. 5) of finding one of the 14 primary species within one of the five assemblages is provided in Table 4. Most indicator species are found in a relatively high number of assemblages; hence the probability of finding a species in one particular assemblage is generally rather low. There is, however, a relatively high probability of finding T. nybelini and L. decagonus in the shallow Assemblage 1, C. reinhardti and C. microps in Assemblage 2, A. atlanticus in Assemblage 3, C. microps in Assemblage 4 and G. ensis in Assemblage 5. Further, A. hyperborea is relatively common in Assemblages 2–5. Otherwise the indicator species have <15% probability of being found in any of the Assemblages. It should be noted that abundance differences among assemblages are not included in these probabilities and the probabilities can only be used for direct comparison within assemblages.
Discussion
The abundance of Greenland halibut R. hippoglossoides and the sea snail L. fabricii were high in nearly all hauls (Fig. 2) and often orders of magnitude higher than any other species found. This type of situation is expected in Arctic environments where diversity is generally lower than areas to the south. This meant that the data on abundance of these two species did not contribute information to aid in the discrimination between assemblages. If these data were included in the model it would reduce the estimated probabilities that a fish caught would belong to any other species to very low values i.e., other species would be interpreted as noise and it would not be possible to see any difference between assemblages. By exclusion of the dominant species, patterns in associations among the other species emerged. R. hippoglossoides was only missing at three stations (151–341 m, -0.5–+0.3°C). In a similar analysis covering the Davis Strait and southern part of the Baffin Bay it was also found in almost all assemblages, except two shallow ones, but it was not as dominant. It was, however, concluded that it was “not very suitable for use in defining assemblages” (Jørgensen et al., 2005). L. fabricii was also found at all stations except three (154–485 m, -0.5–+1.5°C). In Jørgensen et al. (2005) the species was considered as generalist (eurytrophic) found in three assemblages in the deep, cold Baffin Bay.
There are remarkably more species off the northwest coast of Greenland than off the northeast coast of Baffin Island. The Greenland survey (Jørgensen, MS 2005) had more extensive coverage of shallow waters which might explain the occurrence of the greater number of sculpins (five species) and lumpsuckers (three species) all associated with shallow water. Apart from A. glacialis the remaining species found exclusively off Greenland were boreal species such as A. agassizii, B. glaciale, and S. mentella that probably are transported into the area by the relative warm West Greenland Current.
This study shows that five assemblages with different mean temperature, mean depth and species composition could be identified in the northern part of Baffin Bay. A similar study in the southern part of Baffin Bay (Jørgensen et al., 2005) identified seven assemblages of which four were located, two in the Davis Strait and one mainly in Davis Strait but scattered into Baffin Bay. The two studies used similar sampling methods which allows for easier comparison between these adjacent areas. No other studies of fish assemblages in arctic marine waters of the Northwest Atlantic have been conducted so the following discussion will focus primarily on comparing results from this study with those of Jørgensen et al. (2005).
Jørgensen et al. (2005) identified a shallow assemblage with the indicator species T. nybelini, A. atlanticus, L. decagonus, Lycodes vahli, A. radiata, Anarhichas minor, C. reinhardti and Leptoclinus maculatus which was almost exclusively found off Northwest Greenland. The assemblage was, however, found in much warmer (average temperature = 2.9°C) and shallower (average depth = 303 m) waters. The assemblage could to some extent be followed further north along the west coast of Greenland and into the shallow central part of northern Baffin Bay, Assemblage 1 in this investigation, where T. nybelini and L. decagonus are also primary indicator species and A. atlanticus are rather abundant. A. radiata, C. reinhardti were indicator species in the shallow assemblage identified by Jorgensen et al. (2005) and are also indicator species in Assemblage 2, but species such as L. vahli, A. minor, and L. maculatus that were found to be indicator species by Jørgensen et al. (2005) are not observed in these investigations at all. The difference in species composition between shallow areas in southern Baffin Bay-Davis Strait and northern Baffin Bay could be due to differences in temperature caused by a gradual weakening and cooling of the West Greenland Current as it flows north. Generally the shallow areas are poorly covered in both investigations but especially off Canada. There was only one haul from Assemblage 1 found on the Baffin Island side but given the amount of habitat with similar depth and temperature characteristics this assemblage could be wide spread in that area.
It is therefore unclear whether the shallow assemblages identified in both southern Baffin Bay and in northern Baffin Bay in this study are also found in shallow waters off Baffin Island.
Assemblages 1, 2 and 3 are not statistically different either in mean depth or mean temperature but do have different species composition, therefore, temperature and depth do not seem to be important factors in the separation of the shallow assemblages. Differences in salinity or other oceanographic or ecological factors such as benthic habitat type or inter-specific competition may be factors that are causing the split between these assemblages but this type of investigation is beyond the scope of this paper.
Assemblages 2 and 3 resemble an assemblage found in the southern part of Baffin Bay with similar mean depths (average depth = 535 m) but with somewhat warmer temperatures (average temp = 2.0°C). There were no indicator species in that assemblage but R. hippoglossoides was by far the most dominant species and it was also characterized by the presence of A. atlanticus and other shallow water species such as Hippoglossoides platessoides and T. nybelini. A. atlanticus is a primary indicator species for Assemblage 3 in this study and T. nybelini is rather common in Assemblage 2, while the more boreal species H. platessoides is not observed in the cooler northern areas.
Assemblage 4 resembles an assemblage found by Jørgensen et al. (2005) in the southern part of the Baffin Bay (average depth = 886 m and average temperature = 1.0°C). This assemblage was without primary or secondary indicator species but R. hippoglossides was dominant with G. ensis and L. eudipleurostictus also present. The latter species is a primary indicator species in Assemblage 4 and G. ensis is also found in Assemblage 4, and to a larger extent, in Assemblage 5. L. mcallister is also a primary indicator species in Assemblage 4 but was found to be few in number and neither a primary nor secondary species in the southern part of Baffin Bay (Jørgensen et al., 2005).
The deepest assemblage in Baffin Bay (Assemblage 5) (average depth = 1 088 m and average temperature = 0.4°C) is characterized by the primary indicator species R. regina and P. bathybius and the secondary indicator species L. adolfi. These species were also indicator species, together with A. hyperborea (which is also abundant in Assemblage 5), in a similar assemblage found in the southern part of Baffin Bay (average depth = 1 116 m and average temperature = 0.7°C) (Jørgensen et al., 2005).
As noted above, the two deepest assemblages in this investigation have similar temperature and depth characteristics as two assemblages in the southern part of Baffin Bay (Jørgensen et al., 2005). These deep, cold-water assemblages seem to be distributed along the entire slope within Baffin Bay and they also have considerable resemblance to the cold Arctic “Norwegian Sea Deep-water assemblage”, depths ranging from 1498–2 051 m, defined by Bergstad et al. (1999) from the slope of the eastern Norwegian Sea. The latter was dominated by Lycodes frigidus, which has never been caught in the Davis Strait/Baffin Bay area, and the two Liparids, P. bathybius and R. regina, which are also common in the deep, cold part of Baffin Bay. A. hyperborea is common in the deepest, coldest Baffin Bay assemblage (Assemblage 5), and was also one of the dominating species in the “upper slope (cold) assemblage” defined by Bergstad et al. (1999).
Baffin Bay borders or is in close proximity to the Arctic Ocean, the Northwest Atlantic and the Northeast Atlantic and there seems to be a mix of species from the three areas in Baffin Bay. Of the 19 primary and secondary species two, L. mcallister and C. kidoi, are found exclusively in the Baffin Bay area (Møller et al., 2010). Four species are found primarily in the Arctic Ocean (L. seminudus, T. nybelini, P. bathybius and R. regina), three species have an easterly distribution i.e. in the Northeast Atlantic (A. hyperborea, L. adolfi and L. paamiuti), while a single species is primarily found in the Northwest Atlantic (G. ensis). A. radiata, M. berglax, A. atlanticus, C. microps, C. reinhardti and L. reticulatus are found wide spread in the North Atlantic and L. eudipleurostictus, L. decagonus also distributes into the Arctic Ocean. R. hippolglosoides and L. fabricii are found wide spread in the North Atlantic and North Pacific and in a circumpolar distribution pattern in the Arctic Seas, respectively (Møller et al., 2010). All the assemblages seem, however, to be composed of species of different origin.
This study together with the study done by Jørgensen et al. (2005) provide a more complete understanding of the fish assemblages currently found in the Arctic region of the Northwest Atlantic. This information will be useful to researchers and managers interested in the marine ecosystem and biodiversity of this region, particularly with respect to climate change and the methods applied here could be repeated in future to examine fisheries survey data from this area for indications of changes over time that may be brought on by anthropogenic or other processes.
Acknowledgements
The authors express their thanks to two reviewers for constructive comments and suggestions that helped improve the final version of the manuscript. The authors also express their thanks to Greenland Institute of Natural Resources and Fisheries and Oceans Canada for access to survey data and financial support. Additional financial support was provided by the Government of Greenland, Department for Culture, Education, Science and Church and for the Canadian survey by the Government of Nunavut, Department of Environment, Fisheries and Sealing Division; Nunavut Wildlife Management Board; Baffin Fisheries Coalition and Nunavut Tunngavik Incorporated.
References
BERGSTAD, O. A., O. BJELLAND, and J. D. M. GORDON. 1999. Fish communities on the slope of the eastern Norwegian Sea, Sarsia, 84: 67–78.
BUCH, E. 2000. A monograph on the physical oceanography of the Greenland waters. Danish Metrological Institute Sci. Rep., No. 00–12.
CONGDON, P. 2001. Bayesian statistical modeling. Wiley, London, p. 42–43.
DUFRÊNE, M., and P. LEGENDRE. 1997. Species assemblages and indicator species. Ecol. Monogr., 67: 345–366.
GILKS, W. R., A. THOMAS, and D. J. SPIEGELHALTER. 1994. A language and program for complex Bayesian modeling. Statistician, 43: 169–178. doi:10.2307/2348941
GILKS, W. R., S. RICHARDSON, and D. J. SPIEGELHALTER (eds). 1996. Markov chain Monte Carlo in Practice. Chapman and Hall, London, UK.
JØRGENSEN, O. A. MS 1998. Survey for Greenland Halibut in NAFO Division 1C-1D. NAFO SCR Doc., No. 25, Serial No. N3010, 26 p.
MS 2005. Survey for Greenland Halibut in the Northern Part of Baffin Bay, NAFO Division 1A, 2004. NAFO SCR Doc., No. 14, Serial No 5093, 12 p.
JØRGENSEN, O. A., C. HVINGEL, P. R. MØLLER, and M. A. TREBLE. 2005. Identification and mapping of bottom fish assemblages in Davis Strait and Southern Baffin Bay. Can. J. Fish. Aquat. Sci., 62: 1833–1852. doi:10.1139/f05-101
LEGENDRE, P., and L. LEGENDRE. 1998. Numerical Ecology. Amsterdam. Elsevier.
MATHERON, G. 1962. Traités de Géostatistiques Appliquée. Paris: Editions technip. MØLLER, P.R., J. G. NIELSEN, S. W. KNUDSEN, J. Y. POULSEN, K. SÜNKSEN, and O. A. JØRGENSEN. 2010. A checklist of the fish fauna of Greenland waters. Zootaxa, 2378: 1–84.
Primer. 2001. Primer software for Windows v. 5.2. PRIMER-E Ltd. 6 Hedingham Gardens. Roborough. Plymouth. PL6 7DX, United Kingdom.
RISS-CARSTENSEN, E. 1948. Den Grønlandske Lods. I. Del Vestgrønland. Det Kongelige Danske Søkort-Arkiv, Copenhagen. [In Danish]
TREBLE, M. A. MS 2005. Analysis of data from the 2004 trawl survey in NAFO Division 0A. NAFO SCR Doc., No. 56, Serial No. N5142, 24 p.
SOUISSI, S., F. IBANEZ, R. B. HAMADOU, J. BOUCHER, A. C. CATHALINEUA, F. BLANCHARD, and J.C. POULARD. 2001. A new multivariate mapping method for studying species assemblages and their habitats: example using bottom trawl surveys in the Bay of Biscay (France). Sarsia, 86: 527–542.
SPIEGELHALTER, D. J., A. THOMAS, and N. BEST. 2000. WinBUGS version 1.3 User Manual. MRC Biostatistics Unit, Inst. of Public Health, Cambridge, England.
YABE, M. 1995. Cottidae, Psychrolutidae. In: O. OKAMURA, K. AMAOKA, M. TAKEDA, K. YANO, K. OKADA, and S. CHIKUNI (eds.). Fishes collected by the R/V Shinkai Maru around Greenland. Japan Marine Fishery Resources Research Center, Tokyo, p. 161–170.
WHITEHEAD, P. J. P., M.-L. BAUCHOT, J.-C. HUREAU, J. NIELSEN, and E. TORTONESE (eds). 1984–1986. Fishes of the North-eastern Atlantic and the Mediterranean. UNESCO, Paris.
|