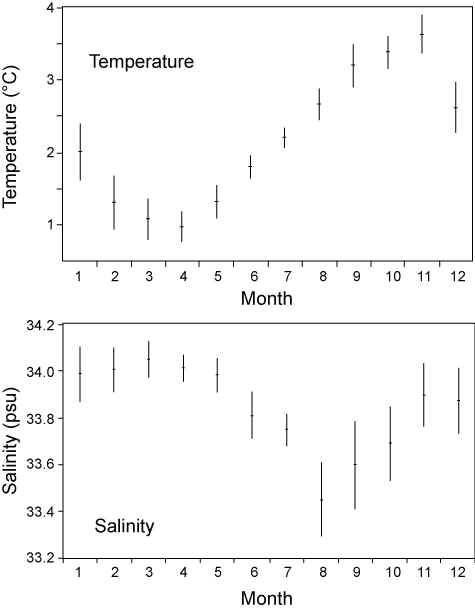
| Fig. 2a. The seasonal variation of thermohaline conditions over the 0–500 m depth range at Station 4, Fyllas Bank, from 1946–1988. Monthly means and 95% confidence intervals shown. |
| Fig. 2a. The seasonal variation of thermohaline conditions over the 0–500 m depth range at Station 4, Fyllas Bank, from 1946–1988. Monthly means and 95% confidence intervals shown. |