|
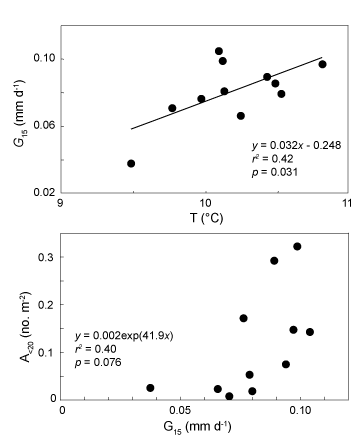
Fig. 3. Relationships between mean larval growth rate (G15, mm d-1) and mean temperature experienced by Japanese sea bass during the larval stage (T, °C) from 1990 to 2000 (top) and between abundance of Japanese sea bass <20 mm in standard length (A<20) in the Chikugo Estuary to the mean larval growth rate (G15, mm d-1) from 1990 to 2000 (bottom). |
|