|
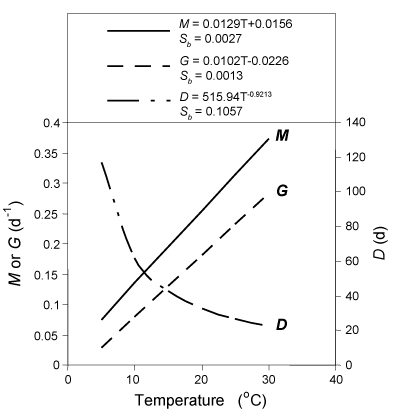
Fig. 4. Summary figure of daily Mortality (M), weight-specific Growth (G), and a power model regression for Larval Stage Duration (days, D), based on meta-analysis of marine fish larvae in relation to temperature, derived from relationships in Houde (1989). Lines are the fitted linear regressions for G, M and D. Sb = standard error of the regression coefficient. (modified from Houde, in press, Fig. 8). |
|