|
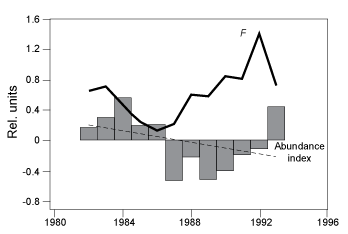
Fig. 6. Fishing mortality F (solid lines) and cod abundance index (histogram) according to Myers et al. (1997). The abundance index is defined as the log ratio of numbers at age 3 from VPA and survey, i.e. log (VPAage3/Surveyage3). Abundance index becomes negative as F increases rapidly, i.e. VPA underestimates mortality. The linear trend for the abundance index (dashed line) is negative for the time period covering the collapse of cod stocks off Greenland. Mortality data as in Fig. 5A. |
|